. 2022 Nov 1;29(1):92–99. doi: 10.1158/1078-0432.CCR-21-3577

Figure 1.

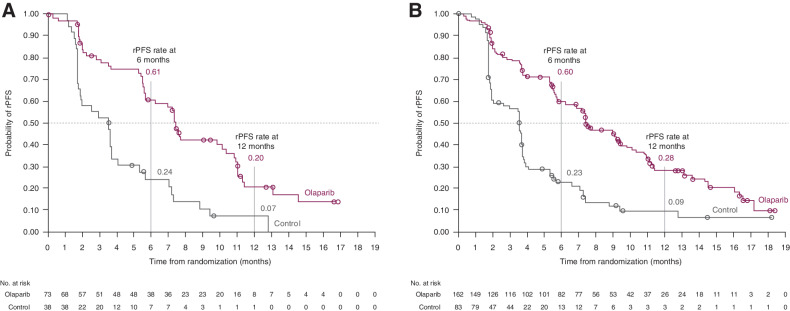
Figure 1. Kaplan–Meier plot of rPFS in cohort A ctDNA subgroup* (A), and cohort A ITT population† (B). *Patients with BRCA/ATM alterations identified by ctDNA testing; †Patients with BRCA/ATM alterations identified by tissue testing. BRCA/ATM; BRCA1, BRCA2, or ATM; ctDNA, circulating tumor DNA; ITT, intention-to-treat; rPFS, radiographic progression-free survival. Figure 1B from N Engl J Med, de Bono J, et al., Olaparib for Metastatic Castration-Resistant Prostate Cancer, Vol. 382, pp. 2091–102, Copyright 2020 Massachusetts Medical Society. Reprinted with permission from Massachusetts Medical Society.

Kaplan–Meier plot of rPFS in Cohort A ctDNA subgroup* (A), and Cohort A ITT population (B). *Patients with BRCA/ATM alterations identified by ctDNA testing; Patients with BRCA/ATM alterations identified by tissue testing. (Figure 1B from N Engl J Med, de Bono J, et al., Olaparib for Metastatic Castration-Resistant Prostate Cancer, Vol. 382, pp. 2091–102, Copyright 2020 Massachusetts Medical Society. Reprinted with permission from Massachusetts Medical Society.)