. 2022 Sep 8;29(1):174–182. doi: 10.1158/1078-0432.CCR-22-1138

Figure 2.

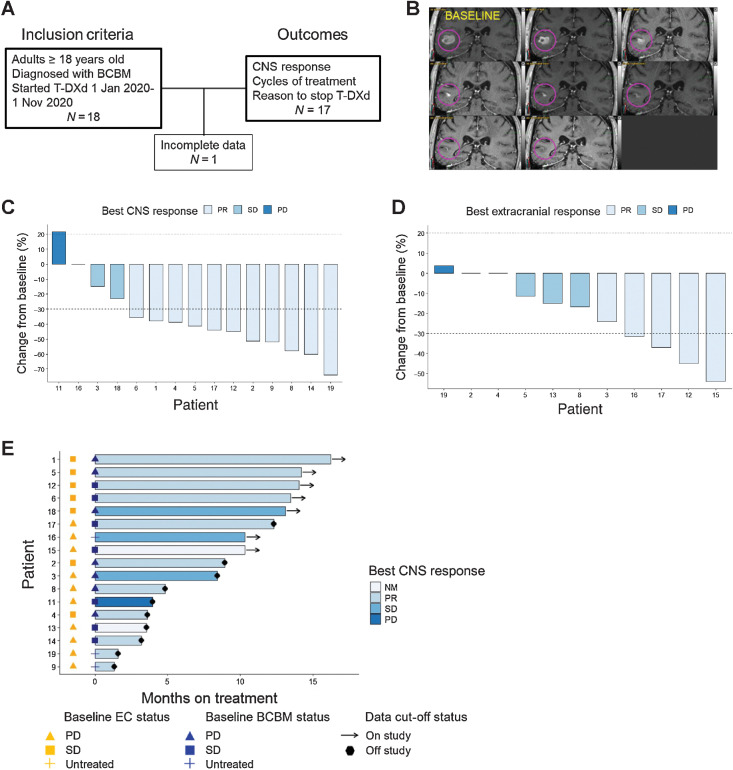
Figure 2. Response to T-DXd in patients with BCBMs. A, Study scheme showing study entry criteria and reported outcomes. B, Contrast-enhanced brain MRIs of patient response to T-DXd. Baseline image shown at top left and images arranged in serpentine succession at restaging intervals show evidence of durable response. The lesion shown had not received prior stereotactic radiosurgery and the patient had progressed through prior treatment with T-DM1, neratinib, and tucatinib. C, Best CNS response to T-DXd. Waterfall plot of best CNS response in patients with measurable disease (n = 15). D, Best extracranial response to T-DXd. Waterfall plot of best extracranial response in patients with measurable disease (n = 11). E, Months on treatment with T-DXd. Swimmer plot showing patient (n = 17) cycles on treatment with T-DXd by baseline extracranial (EC) disease (gold shapes) and BCBM status (navy blue shapes). A total of 10 of 17 (59%) had progressive or untreated CNS disease at baseline. NM = nonmeasurable, PR = partial response, SD = stable disease, PD = progressive disease.

Response to T-DXd in patients with BCBMs. A, Study scheme showing study entry criteria and reported outcomes. B, Contrast-enhanced brain MRIs of patient response to T-DXd. Baseline image shown at top left and images arranged in serpentine succession at restaging intervals show evidence of durable response. The lesion shown had not received prior stereotactic radiosurgery, and the patient had progressed through prior treatment with T-DM1, neratinib, and tucatinib. C, Best CNS response to T-DXd. Waterfall plot of best CNS response in patients with measurable disease (n = 15). D, Best extracranial response to T-DXd. Waterfall plot of best extracranial response in patients with measurable disease (n = 11). E, Months on treatment with T-DXd. Swimmer plot showing patient (n = 17) cycles on treatment with T-DXd by baseline extracranial (EC) disease (gold shapes) and BCBM status (navy blue shapes). A total of 10 of 17 (59%) had progressive or untreated CNS disease at baseline. NM, nonmeasurable; PR, partial response; SD, stable disease; PD, progressive disease.