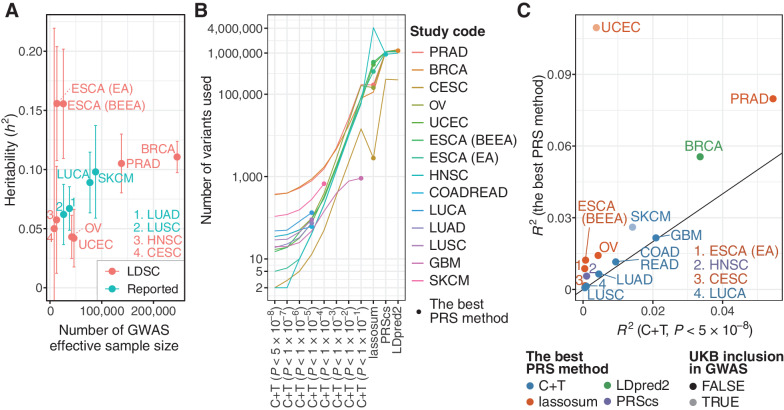
Figure 2.
Construction and evaluation of PRSs. A, A scatter plot showing heritability (h2) and effective sample size of the GWAS summary statistics. Heritability was estimated by LD score regression (LDSC) for GWASs, in which genome-wide variants were available. For others, heritability estimated by LDSC was obtained from the original articles if reported (Reported). GBM and COADREAD were excluded because heritability estimated by LDSC was not reported for these cancer types. Error bars, 95% confidence interval. B, The number of variants used for calculating PRSs. For six GWAS summary statistics in which genome-wide variants were unavailable, only C+T was conducted for PRS calculation. C, The difference of Nagelkerke's R2 for the C+T PRS with genome-wide significant variants (i.e., P < 5×10⁻⁸; x-axis) and the best PRS (y-axis). It was calculated in UKB as a difference between the full model and the reduced model including all covariates but PRS. UCEC and SKCM are shown in light colors because UKB was included in the GWAS cohort for these two cancer types.

