. 2022 Oct 26;83(1):20–27. doi: 10.1158/0008-5472.CAN-22-1492

Figure 3.

Figure 3. Germline–somatic association analyses in TCGA. A, The associations between PRS values and somatic/clinical features of cancer. Pooled effect size (standardized mean difference; SMD) of PRS values for evaluated features (left). Heatmap, indicating the SMD of PRS values for each feature in each cancer type (right). SCNA, somatic copy-number alteration; LOH, loss of heterozygosity. B, Forest plots of cancer type–specific and pooled SMD of PRS values for driver mutations. Genes listed as drivers in three or more cancer types were evaluated.

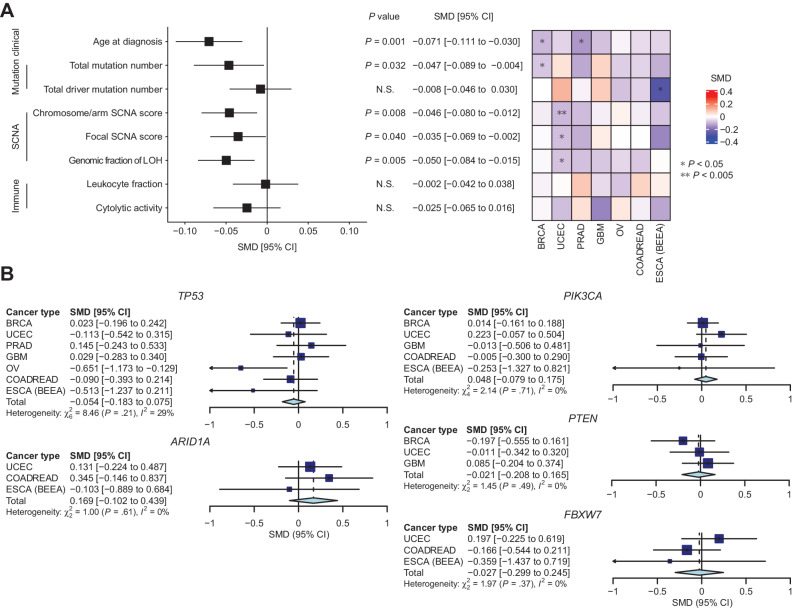
Germline–somatic association analyses in TCGA. A, The associations between PRS values and somatic/clinical features of cancer. Left, pooled effect size (standardized mean difference, SMD) of PRS values for evaluated features. Right, heatmap indicating the SMD of PRS values for each feature in each cancer type. B, Forest plots of cancer type–specific and pooled SMD of PRS values for driver mutations. Genes listed as drivers in three or more cancer types were evaluated.