. 2022 Oct 21;29(1):209–220. doi: 10.1158/1078-0432.CCR-22-1654

Figure 2.

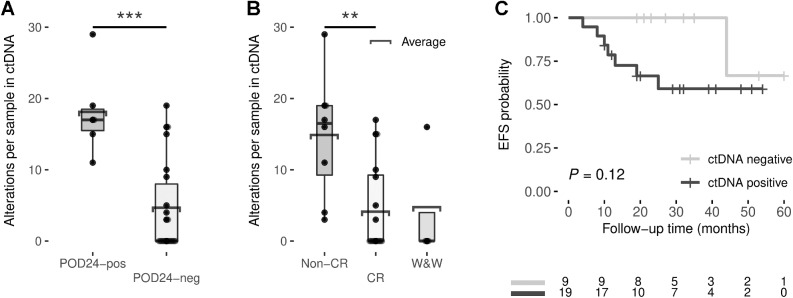
Figure 2. Box plots showing the number of alterations per basal cfDNA sample by POD24 (A) or response to treatment (B). C, Kaplan–Meier estimates of EFS based on risk groups determined by pretreatment ctDNA detection. EFS differences between risk groups were tested using the log-rank test. *, P <  0.05; **, P < 0.01; ***, P < 0.001.

Box plots showing the number of alterations per basal cfDNA sample by POD24 (A) or response to treatment (B). C, Kaplan–Meier estimates of EFS based on risk groups determined by pretreatment ctDNA detection. EFS differences between risk groups were tested using the log-rank test. *, P <  0.05; **, P < 0.01; ***, P < 0.001.