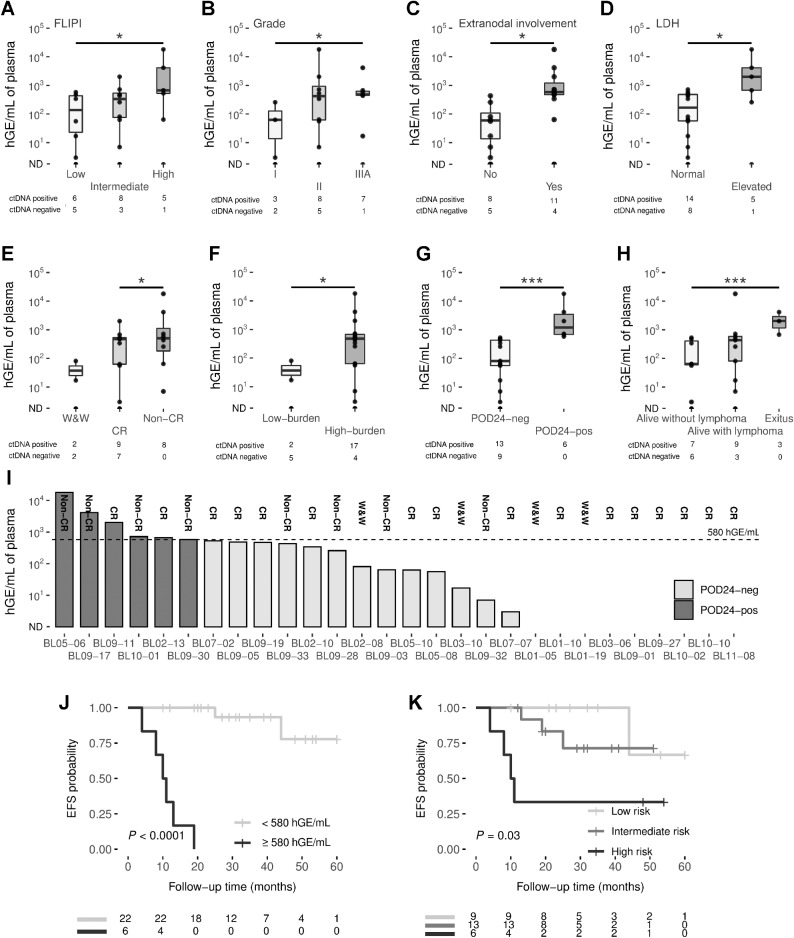
Figure 3.
A, Box plots showing significant correlations of pretreatment ctDNA levels with FLIPI (A); grade (B); extranodal involvement (C); LDH (D); response to treatment (E); tumor burden (F); progression of disease within 24 months (G); and patient status (H). Group differences were assessed with the Mann–Whitney U test. The box plot represents the quartiles and the median for the hGE/mL values. I, The bar graph shows the levels of ctDNA in pretreatment cases, measured by hGE/mL. POD24 status is coded by color (see figure box legend). J, Kaplan–Meier estimates of EFS based on risk groups determined by hGE/mL levels, and (K) the combination of FLIPI and ctDNA levels. EFS differences between risk groups were tested using the log-rank test. *, P < 0.05; **, P < 0.01; ***, P < 0.001. LDH, lactate dehydrogenase; ND, non-detected.

