. 2022 Oct 21;29(1):209–220. doi: 10.1158/1078-0432.CCR-22-1654

Figure 4.

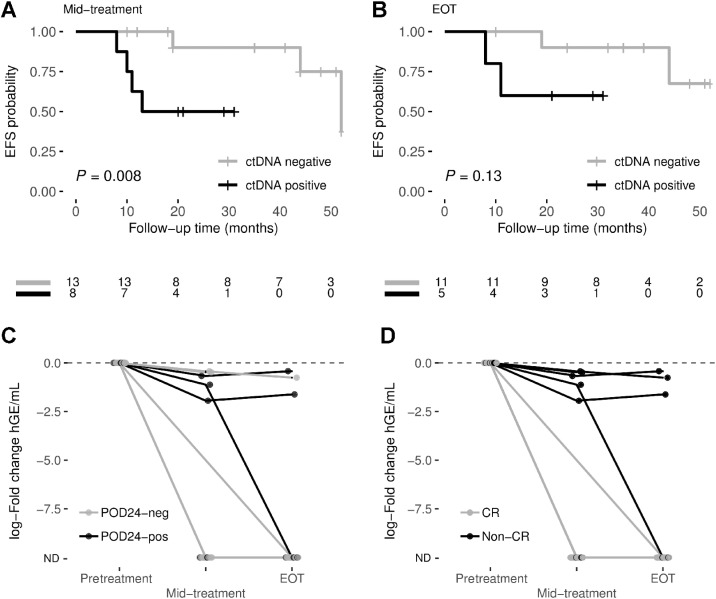
Figure 4. Prognostic value of dynamic analysis of ctDNA. Kaplan–Meier estimates of EFS probabilities are shown for ctDNA-positive (at least one mutation detected in cfDNA) and ctDNA-negative patients at (A) mid-treatment, and (B) end-of-treatment. EFS differences between groups were tested using the log-rank test. The dynamic of ctDNA levels, measured as log10 fold-change, grouped by their (C) POD24 status and (D) response to treatment, is represented for each patient. ND, non-detected.

Prognostic value of dynamic analysis of ctDNA. Kaplan–Meier estimates of EFS probabilities are shown for ctDNA-positive (at least one mutation detected in cfDNA) and ctDNA-negative patients at (A) mid-treatment, and (B) end-of-treatment. EFS differences between groups were tested using the log-rank test. The dynamic of ctDNA levels, measured as log10 fold-change, grouped by their (C) POD24 status and (D) response to treatment, is represented for each patient. ND, non-detected.