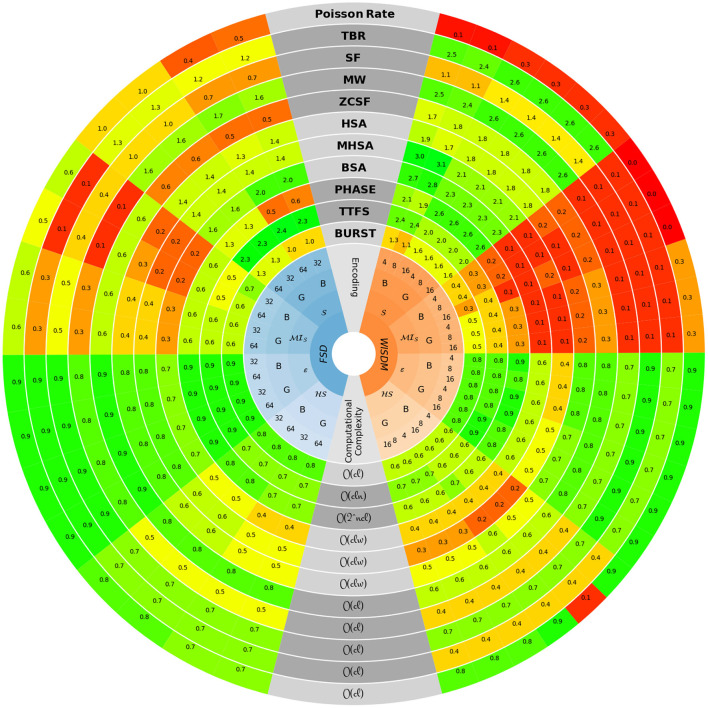
Figure 12.
The characterization of each encoding technique is presented along specific rings of the circle-shaped graph. The bottom, central part reports the computational complexity, defined through the quantities l (signal length), c (number of channels), n (length of the bitwise representation) and w (width of the convolution function). The left-hand side refers to the values achieved on FSD data, while the right-hand side refers to those obtained with the WISDM dataset. The four signals-related metrics, namely , , and ε, are shown in a mirrored arrangement with respect to the vertical symmetry axis of the circle. For each of them, the results provided by the two filter types, i.e., Butterworth (B) and Gammatone (G), are reported according to the number of channels used to split the original signal.

