Figure 2.
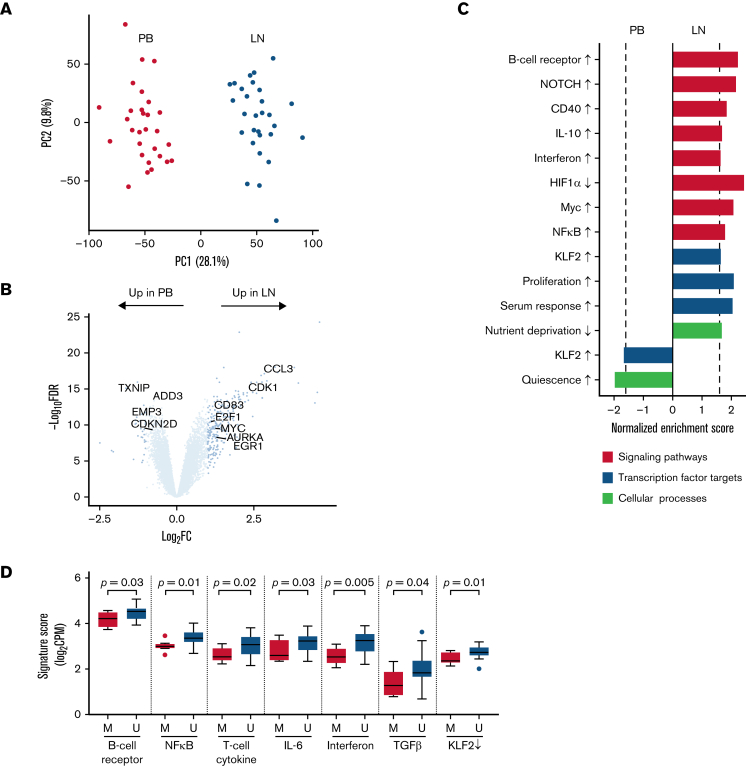
The CLL transcriptome is modulated by the tumor microenvironment. (A) Principal component analysis of bulk RNA-seq in CD19+ tumor cells from paired PB (red) and LN (green) samples (n = 29 pairs). (B) Volcano plot of log2 fold-change (FC) in gene expression between PB and LN bulk RNA-seq vs -log10 false discovery rate (FDR). Differentially expressed genes (dark blue, n = 285) were defined as FC ≥2 and FDR <0.05. (C) Gene signatures enriched (normalized enrichment score ≥|1.6| as shown by the dotted line and FDR <0.05) in either PB or LN bulk RNA-seq. Signatures were categorized as signaling pathways, transcription factor targets, and cellular processes. Signatures comprised of upregulated genes are indicated by an up arrow (↑) while downregulated genes are indicated by a down arrow (↓). (D) Comparison of the indicated signatures between mutated (M; n = 8) and unmutated (U; n = 21) CLL. A signature score is the average expression of genes comprising each signature for a given sample. Box and whiskers show the median, IQR, and 1.5 times IQR of the indicated signature scores across LN samples. IQR, interquartile range.

