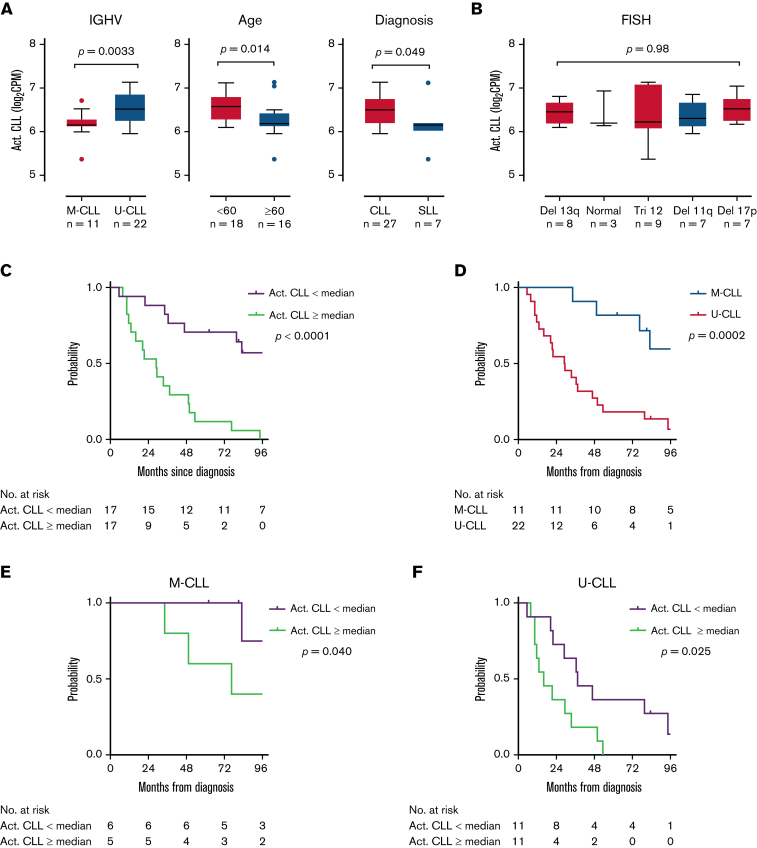
Figure 4.
The activated CLL signature is associated with disease aggressiveness. (A,B) Comparison of the activated CLL signature between clinical subgroups. The activated CLL signature was defined as the 10 most differentially expressed genes between activated and quiescent CLL cells in the scRNA-seq dataset. Signature expression was then calculated in bulk RNA-seq data of LN samples. Box and whiskers represent the median, IQR, and 1.5 times IQR. (C-F) Kaplan-Meier plots of TFS in patients with (C) low vs high (below vs equal to or above median) expression of the activated CLL signature, (D) M-CLL vs U-CLL, (E) low vs high signature expression in patients with M-CLL, and (F) low vs high signature expression in patients with U-CLL.

