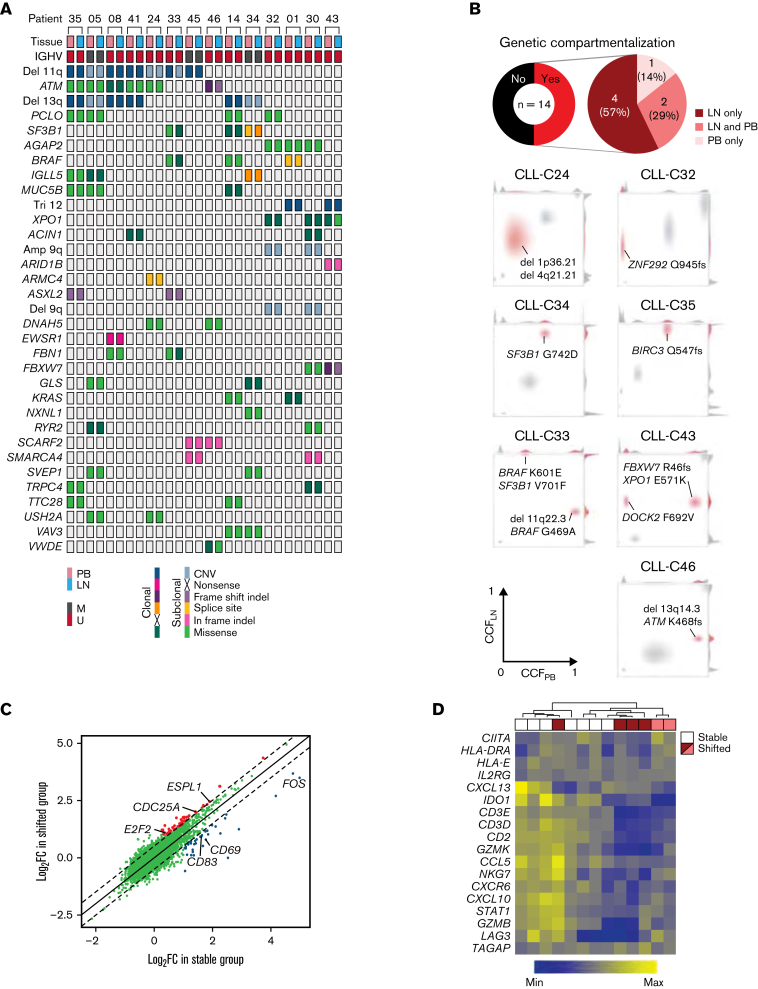
Figure 6.
The immune microenvironment constrains clonal expansion. (A) Distribution of CNAs and nonsilent mutations in WES of paired PB and LN samples in 14 patients. Only CNAs or genes mutated in ≥2 patients are shown. No clonal inframe indels or subclonal nonsense mutations were detected. (B) Top: pie charts of the proportion of patients with genetic compartmentalization of subclones defined as an absolute difference in CCF >0.25 between PB and LN by WES. Bottom: density plots of CCF in PB and LN in patients demonstrating subclonal expansion in each compartment (CLL-C33 and CLL-C43), in LN only (CLL-C24, CLL-C32, CLL-C34, and CLL-C35), and PB only (CLL-C46). The subclone(s) with genetic compartmentalization are highlighted in red in each patient. (C) Comparison of mean FC in gene expression by bulk RNA-seq in LN relative to PB between patients with (shifted) and without (stable) subclonal expansion in LN. Each dot is the FC in the expression of a gene in LN relative to PB averaged across 6 patients in the shifted group (y-axis) and 7 patients in the stable group (x-axis). Colored dots are genes with a significant difference in FC between these 2 groups (Δlog2FC >0.5; FDR <0.05). (D) Heatmap of a T-cell inflammatory signature expression by bulk RNA-seq and hierarchal clustering dendrogram of stable (n = 7) and shifted (n = 6) patients. The top row shows stable patients in white and shifted patients in red or pink. Red and pink colors correspond to patients with expanded subclone(s) in LN only and those with expanded subclone(s) in LN and PB, respectively. CNAs, copy number alterations.

