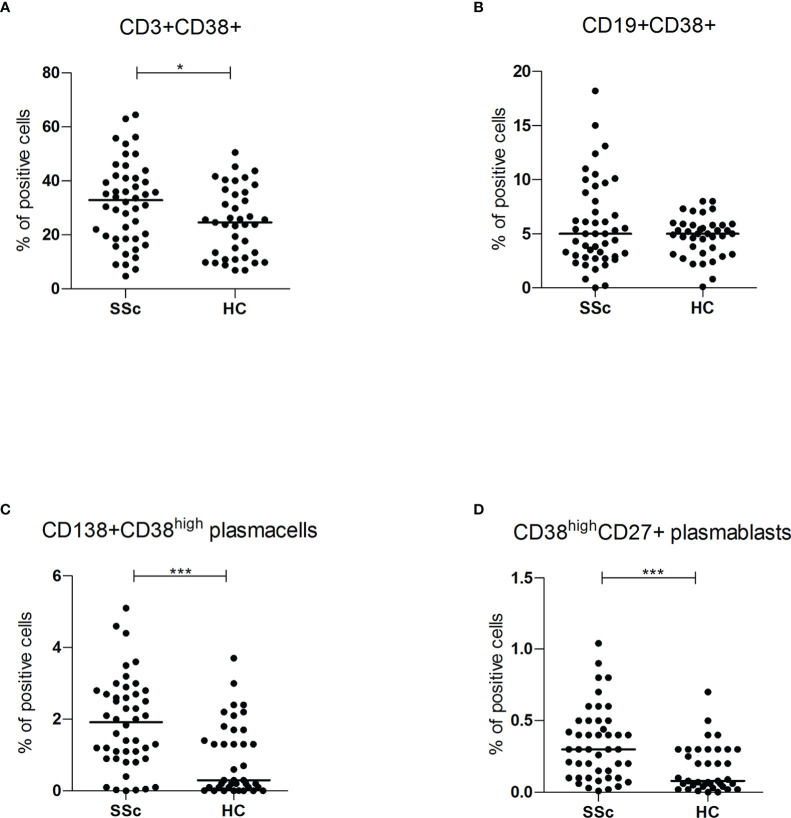
Figure 2.
(A, B) CD3+CD38+ and CD19+CD38+ surface antigen expression of PBMC from SSc patients (SSc; n = 46) and healthy controls (HC; n = 32) were analyzed by flow cytometry. Results are expressed as percentage of positive cells. Horizontal bars represent median values; *= p < 0.05; *** = p < 0.001. Mann-Whitney test was used for inter-groups analysis; (C, D) CD138+CD38high and CD38highCD27+ surface antigen expression of PBMC from SSc patients (SSc; n = 46) and healthy controls (HC; n = 32) were analyzed by flow cytometry. Results are expressed as percentage of positive cells. Horizontal bars represent median values; *= p < 0.05; *** = p < 0.001. Mann-Whitney test was used for inter-groups analysis.

