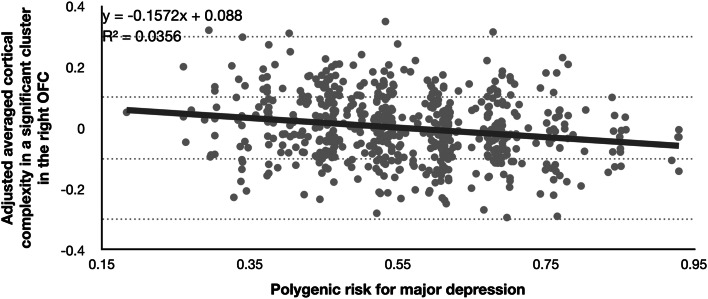
Fig. 2.
Scatter plot showing the association between the polygenic risk score for MDD and adjusted averaged cortical complexity in a significant cluster in the right orbitofrontal cortex. Note. Adjusted cortical complexity values were cluster-wise extracted for every participant using the CAT12 function cat_surf_results. Cluster values were calculated as β-values based on the used contrast of the corresponding multiple regression, including its covariates and residuals. A non-parametric correlation yielded also a significant association: Spearman's ρ = −0.189 (p < 0.0001).

