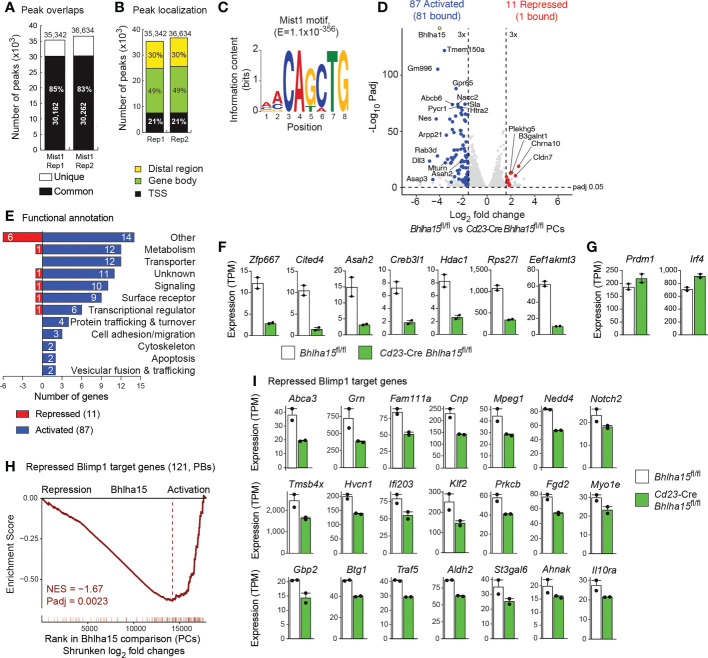
Figure 5.
Mist1-dependent gene expression program in plasma cells. (A–C) Genome-wide Mist1 binding in PBs that were in vitro differentiated for 4 days by LPS stimulation of CD43– B cells from the spleen of Bhlha15 fl/fl Rosa26 BirA/BirA mice. CD138+ PBs, which were purified by immunomagnetic enrichment with CD138-MicroBeads, were used for Bio-ChIP-seq analysis (22), and Mist1 peaks were identified by MACS peak calling with a stringent P value of < 10–10. (A) Overlap and number of Mist1 peaks identified in two Bio-ChIP-seq replica (Rep) experiments. (B) Presence of Mist1 peaks in distal regions, gene bodies and promoter (TSS) regions. Mist1 peaks were assigned to genes, as described (22). (C) Consensus Mist1-binding motif identified with an E-value of 1 x 10-356 by the de novo motif-discovery program MEME-Chip. (D) Volcano plot of gene expression differences between Cd23-Cre Bhlha15 fl/fl and control Bhlha15 fl/fl PCs that were sorted as TACI+CD138+ cells from the spleen at day 7 after NP-KLH immunization. Two independent RNA-seq experiments were performed with PCs of each genotype. Each dot corresponds to one gene, whose expression is plotted as log2-fold change against the -log10 adjusted P value. Genes with an expression difference of > 3-fold, an adjusted P value of < 0.05 and an expression value of > 5 TPM (at least in one sample) are colored in blue or red corresponding to activation or repression by Mist1, respectively. (E) Functional classification and quantification (number) of proteins encoded by Mist1-activated and Mist1-repressed genes. (F) Expression of selected activated Mist1 target genes in Cd23-Cre Bhlha15 fl/fl and Bhlha15 fl/fl PCs. (G) Expression of Prdm1 and Irf4 in Cd23-Cre Bhlha15 fl/fl and Bhlha15 fl/fl PCs. (H) GSEA analysis of 121 repressed Blimp1 target genes (3), as compared to their ranked shrunken log2-fold gene expression changes in Cd23-Cre Bhlha15 fl/fl PCs versus Bhlha15 fl/fl PCs. NES, normalized enrichment score. (I) Expression of repressed Blimp1 target genes in Bhlha15 fl/fl and Cd23-Cre Bhlha15 fl/fl PCs, as determined by RNA-seq. All depicted genes are significantly deregulated with an adjusted P value of < 0.05.

