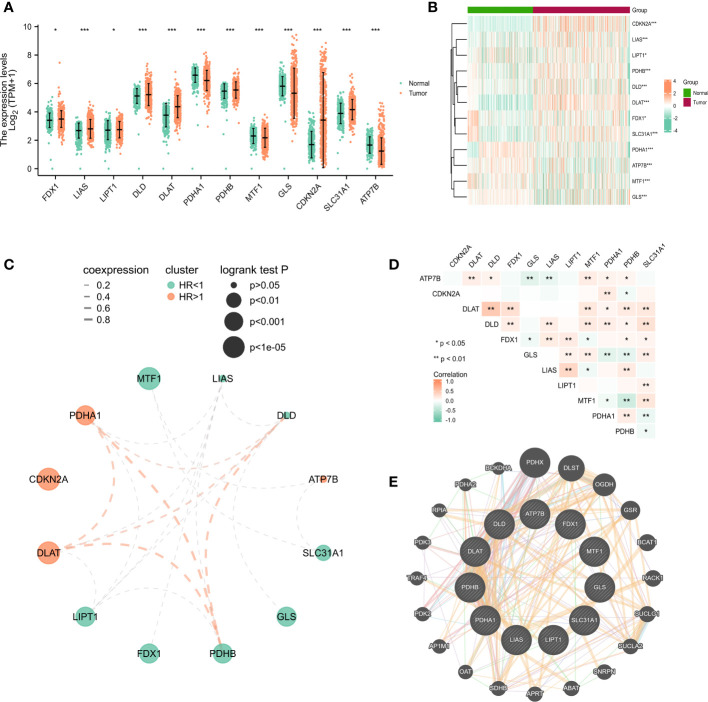
Figure 1.
The expression of cuproptosis-related genes in LUAD patients and their prognostic value. Box plots (A) and heatmap (B) of cuproptosis-related genes in LUAD when compared to normal tissues (with green and red signifying low and high expression levels, respectively). (C) Spearman correlation and prognostic values of cuproptosis-related genes in LUAD patients. Red represents HR>1 whereas green represents HR<1. The larger the circle, the smaller the log-rank p. (D) Correlation analysis between cuproptosis-related genes in LUAD patients. (E) Protein-protein interactions among the cuproptosis-associated genes. The bigger the circle is, the most important gene it might be. * P<0.05, ** P<0.01, *** P<0.001.

