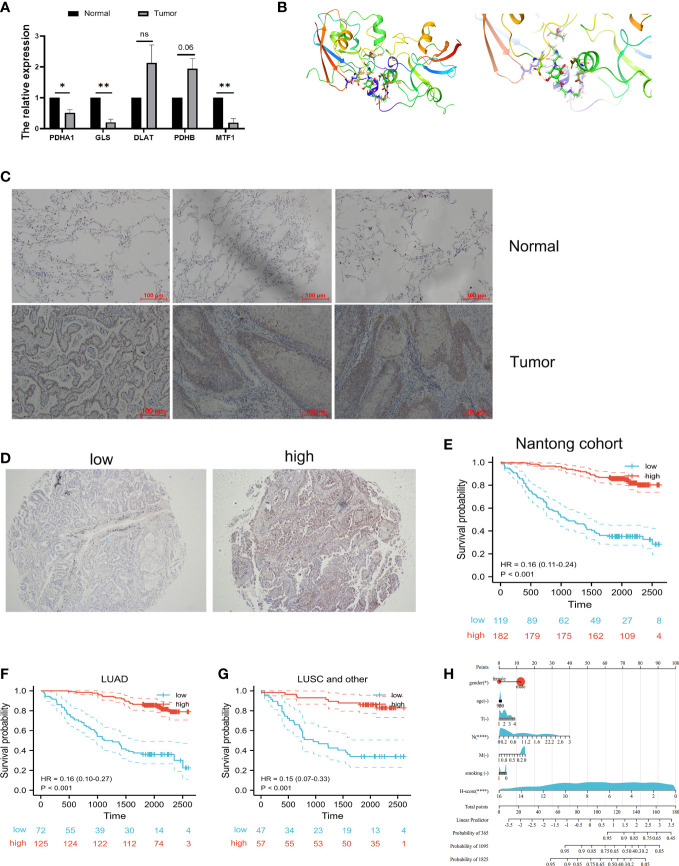
Figure 11.
Validation of vitro experiment and molecular docking. (A) Validation of mRNA expression in prognostic cuproptosis-related signature by qRT-PCR. * P<0.05, ** P<0.01. (B) The molecular docking between FDX1 and mitoxantrone. (C) The IHC results showed that FDX1 protein is highly expressed in tumor tissues when compared with normal tissues. (D) Representative immunohistochemical microarray of FDX1. (E) Kaplan–Meier curves showed that the overall survival of the low-risk set was worse than that of the high-risk set in Nantong cohort. (F, G) Kaplan–Meier curves showed that the overall survival of the low-risk set was worse than that of the high-risk set in LUAD (F) and lung squamous cell (LUSC) subgroups (G) of patients. (H) The nomogram of the H-score and clinical parameters (age, gender, smoking and T, N, M stage) of Nantong cohort. ns, not significant.

