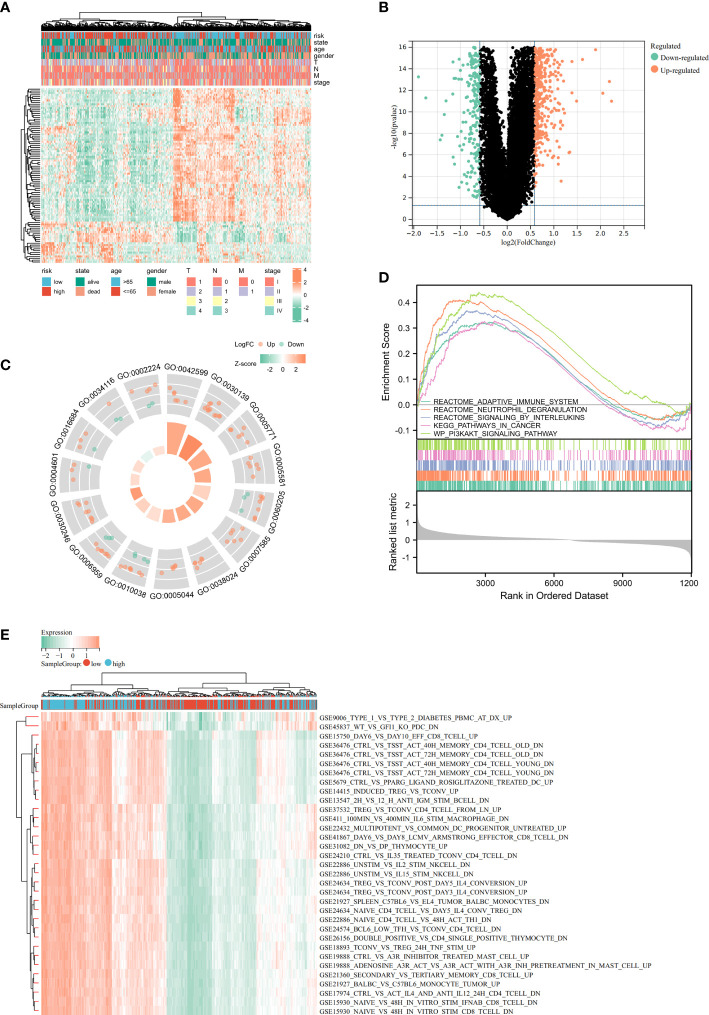
Figure 8.
Identification of differentially expressed genes (DEGs) and potential signaling pathways in different isoforms. The heatmap (A) and volcano plot (B) of the differential gene expression between high and low expressed cuproptosis-related signature in LUAD. GO enrichment (C) and GSEA (D) analysis of the differential expressed genes. (E) GSVA enrichment analysis of the differential genes.

