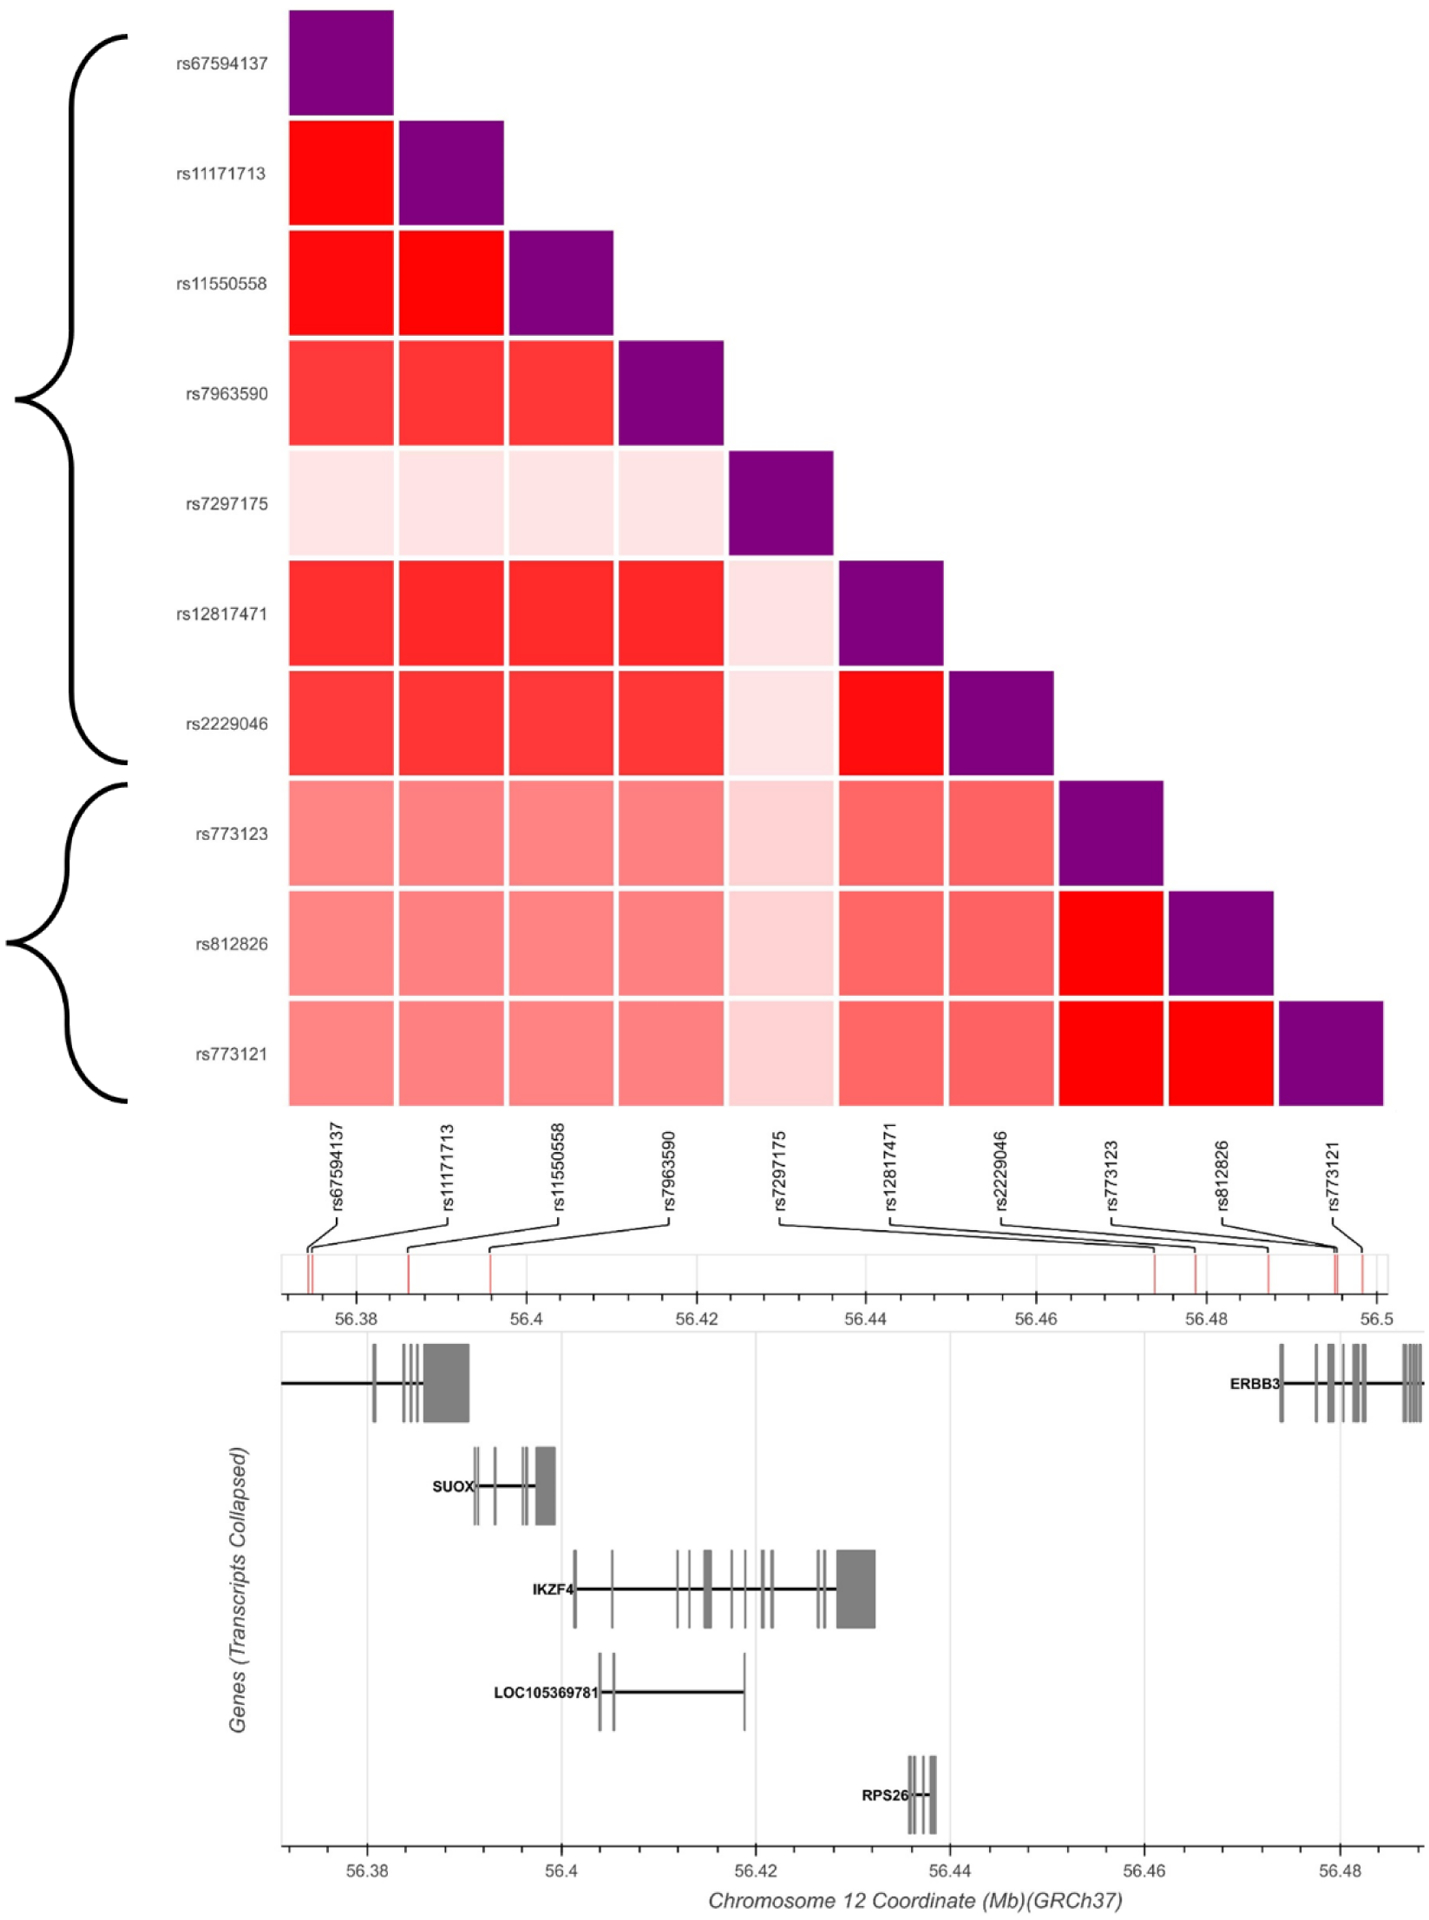
Fig 1. Linkage disequilibrium among chromosome 12 SNVs in Individuals of European Ancestry.

The plot displays linkage disequilibrium as r2 between each pair of SNVs. The brackets outline the two linkage disequilibrium groups (r2 > 0.5). Note that rs7297175 is independent of the other 9 SNVs and is not included in either haplotype block. Darker red indicates higher linkage disequilibrium. SNV locations and genes in the region are displayed at bottom.
