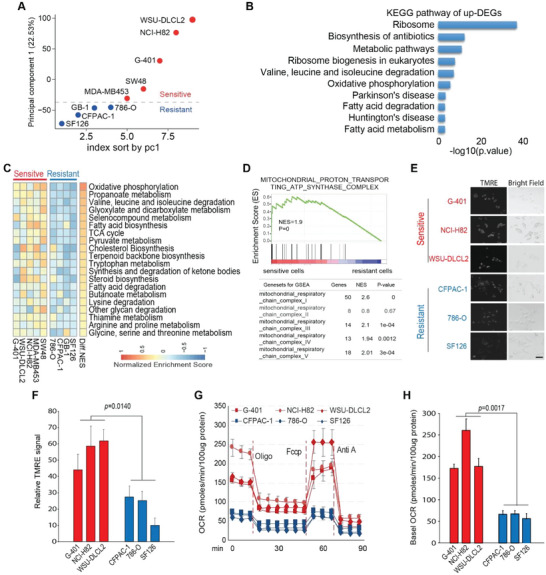
Figure 2.

OXPHOS inhibition‐sensitive cancer cells have potentiated mitochondrial metabolism compared with resistant ones. A) Principal component analysis (PCA) with the whole transcriptome of OXPHOS‐sensitive (NCI‐H82, G‐401, MDA‐MB‐453, WSU‐DLCL2, and SW48) and resistant (786‐O, SF126, CFPAC‐1, and GB‐1) cell lines reveal distinct gene transcription pattern between these two groups of cancer cell lines. Red and blue dots represent OXPHOS‐sensitive and resistant cell lines, respectively. B) KEGG enrichment analysis of upregulated genes in OXPHOS‐sensitive cancer cells reveals that five out of the top ten enriched pathways are metabolism related. C) Gene set variation analysis (GSVA) of metabolic‐related pathways shows that genes functioning in mitochondrial OXPHOS, TCA cycle, and pyruvate‐related metabolism pathways are upregulated in OXPHOS‐sensitive cancer cells. Diff NES: difference of normalized enrichment score (sensitive‐resistant). D) Gene set enrichment analysis (GSEA) shows that genes functioning in mitochondrial OXPHOS complexes I, III, IV, and V but not complex II are significantly enriched in OXPHOS inhibition‐sensitive cancer cells compared with those in resistant ones (CFPAC‐1, 786‐O, and SF126). E,F) TMRM staining analysis manifests higher mitochondrial membrane potential in OXPHOS inhibition‐sensitive cancer cell lines (G‐401, NCI‐H82, and WSU‐DLCL‐2) compared with those in resistant ones. E Representative TMRM staining images by fluorescence microscope of indicated cells. Scale bar 20 um. (E). Quantification of (E) by image J software. Mean± SD. n = 40. Paired t‐test (F). G,H) Basal and maximal oxygen consumption rate (OCR) in OXPHOS inhibition sensitive cancer cells (G‐401, NCI‐H82, and WSU‐DLCL2) is higher than those in resistant ones (786‐O, SF126, and CFPAC‐1). Seahorse analyzer measuring of OCR in OXPHOS inhibition sensitive and resistant cancer cells upon a series treatment as indicated. Cells were treated with Oligomycin A (Oligo,18 min.), Fccp (54 min.), and Antimycin A (Anti A, 72 min.). Mean ± SD; n = 3 (G). Quantification of (G) (H). Data was normalized by 100 µg protein. Mean± SD. n = 3. Paired t‐test.
