Figure 1.

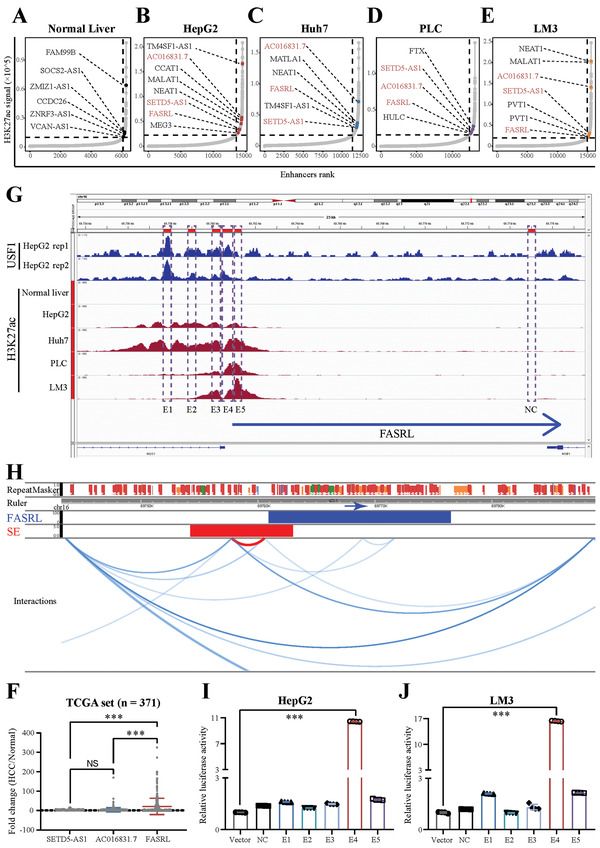
A novel superenhancer‐related lncRNA, FASRL, was identified in HCC. Hockey stick plot showing superenhancer‐related lncRNAs in the A) normal liver and B) HepG2, C) Huh7, D) PLC, and E) LM3 cell lines. The colored dots on the curve indicate some classic and novel lncRNAs in the normal liver and four HCC cell lines. F) The scatter plot showing the fold change in the expression of three lncRNAs in HCC samples compared with normal liver tissue samples. The expression of three lncRNAs in HCC tissues and adjacent normal liver tissues was downloaded from TCGA website. n for HCC = 371, n for Normal = 50; fold change, the ratio of the lncRNA expression in HCC tissues to the mean of lncRNA expression in normal liver tissues. G) ChIP‐seq profiles of USF1 and H3K27ac in normal liver, HepG2, Huh7, PLC, and LM3 cell lines. NC and E1‐E5 represent the genomic positions of the NC sequence and five enhancer sequences, respectively. The blue arrow indicates the FASRL transcription direction. H) Chromatin interaction analysis by paired end labeling (ChIA‐PET) data analysis revealed the spatial interaction between the superenhancer and FASRL promoter on chromatin. SE, superenhancer. The original sequencing data from a ChIA‐PET in the HepG2 cell line were downloaded from the ENCODE database. The dual‐luciferase experiment showing the transcriptional activity of NC and E1‐E5 in the I) HepG2 and J) LM3 cell lines. The data are expressed as the mean ± SD. NS, non‐significance; ***p < 0.001.
