
Figure 2.
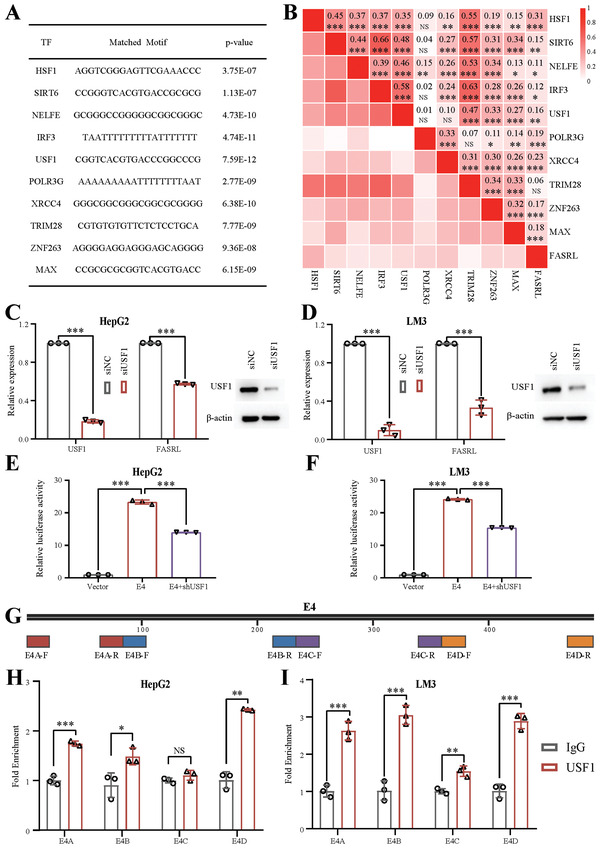
Identification of an upstream TF, USF1, that positively regulated FASRL expression. A) The ten TFs predicted based on the superenhancer sequence of FASRL. B) Correlation analysis of the relative expression of ten TFs and FASRL. The numeric value and color depth represent the correlation coefficient. The expression of ten TFs and FASRL in HCC tissues was downloaded from TCGA website. n for HCC = 371. Left, qRT–PCR showing the relative expression of USF1 and FASRL in the C) HepG2 and D) LM3 cell lines after siRNA‐mediated USF1 knockdown; right, Western blot assay showing the protein content of USF1 in the C) HepG2 and D) LM3 cell lines following siRNA‐mediated USF1 knockdown. The dual‐luciferase experiment showing the transcriptional activity of E4 after USF1 expression was knocked down by shRNA in the E) HepG2 and F) LM3 cell lines. G) The four ChIP–qPCR primer pairs designed on the E4 sequence. ChIP–qPCR analysis of the interaction between USF1 and the components of the superenhancer in the H) HepG2 and I) LM3 cell lines. The data are expressed as the mean ± SD. NS, non‐significance; *p < 0.05; **p < 0.01; ***p < 0.001.