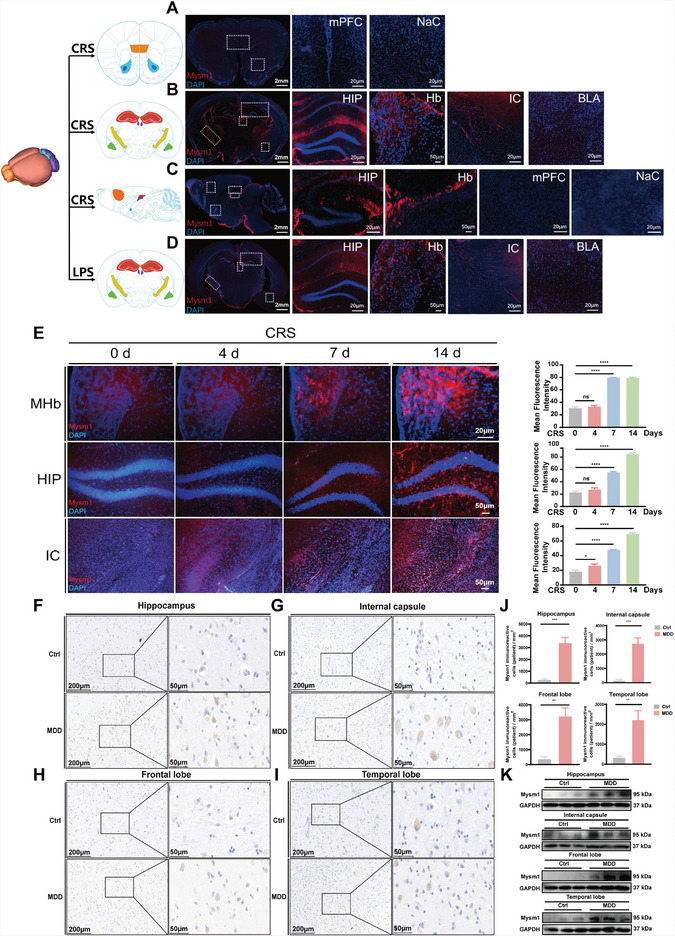
Figure 1.

Mysm1 was increased in the brain tissues from mice with depressive‐like behaviors and from patients with major depression. A,B) Immunofluorescent staining of coronal brain sections in the mPFC, NaC, HIP, Hb, IC and BLA of CRS mice. Scale bars, 2 mm, 100 µm, 50 µm, 20 µm. C) Immunofluorescent staining of sagittal brain sections in the HIP, Hb, mPFC, and NaC of CRS mice. Scale bars, 2 mm, 100 µm. D) Immunofluorescent staining of coronal brain sections in the HIP, Hb, IC and BLA of LPS mice. Scale bars, 2 mm, 100 µm, 50 µm, 20 µm. E) Immunofluorescent staining and quantitative analysis in the MHb, HIP and IC of CRS mice at 0, 4, 7, and 14 days. Scale bars, 50 µm, 20 µm. F–I) Mysm1 expression levels in the hippocampus, internal capsule, frontal lobe, temporal lobe from elderly human patients with MDD (n = 4) and control patients (n = 4) examined by immunohistochemical analysis. Scale bars, 200 µm, 50 µm. J) Quantitative analysis of Mysm1 positive cells in immunohistochemical staining in the hippocampus, internal capsule, frontal lobe, temporal lobe. K) Mysm1 expression levels in the hippocampus, internal capsule, frontal lobe, temporal lobe from elderly human patients with MDD (n = 4) and control patients (n = 4) examined by western blot analysis. Data represent the mean ± SEM; ns, not significant; *p < 0.05, **p < 0.01, ***p < 0.001 and ****p < 0.0001.
