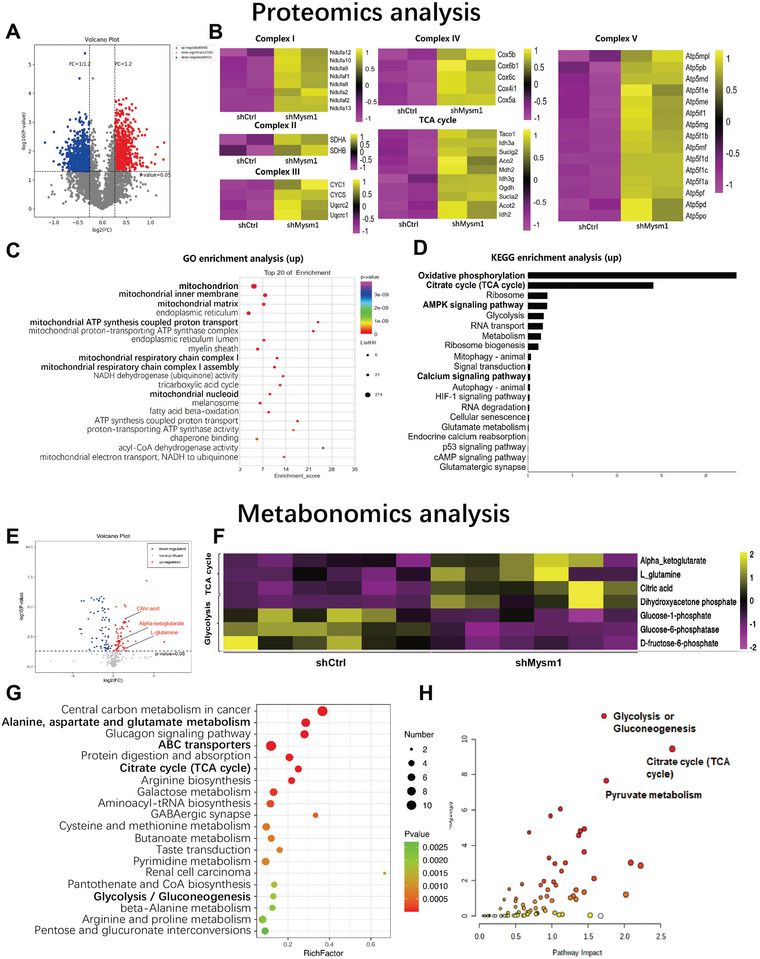
Figure 4.

Downregulation of Mysm1 enhances mitochondrial oxidative phosphorylation in astrocytes. A) Volcano plot of differentially expressed genes between control (shCtrl) and Mysm1 knockdown (shMysm1) astrocytes. The X‐axis represents the fold change, while the Y‐axis indicates the significance of differential expression. The gray points indicate unigenes with no significant change (p < 0.05, false discovery rate (FDR) q < 0.05), while the redpoints and the blue points indicate up‐ and downregulated unigenes (p < 0.05, FDR q < 0.05), respectively. B) Heatmap showing hierarchical clustering of genes upregulated (yellow) or downregulated (pink) in astrocytes. C) Gene ontology enrichment gene number is defined as the number of target genes in each term. The rich factor is defined as the number of target genes divided by the number of all the genes in each term. The number of GO target genes, p value and rich factor are indicated in the scatterplot. D) KEGG pathway enrichment gene number is defined as the number of target genes in each pathway. KEGG pathways were calculated, and those with a p value < 0.05 were defined as significant. E) Volcano plot of differentially expressed metabolites between control (shCtrl) and Mysm1 knockdown (shMysm1) astrocytes. The X‐axis represents the fold change, while the Y‐axis indicates the significance of differential expression. The gray points indicate unigenes with no significant change (p < 0.05, false discovery rate (FDR) q < 0.05), while the redpoints and the blue points indicate up‐ and downregulated unigenes (p < 0.05, FDR q < 0.05), respectively. F) Heatmap showing hierarchical clustering of metabolites upregulated (yellow) or downregulated (pink) in astrocytes. G) KEGG pathway enrichment metabolite number is defined as the number of target metabolites in each pathway. KEGG pathways were calculated, and those with a p value < 0.05 were defined as significant. H) Analysis of Mysm1 downregulation in astrocytes using Metaboanalyst 5.0 Combined with Proteomic and Metabolomic Analysis.
