Figure 2.

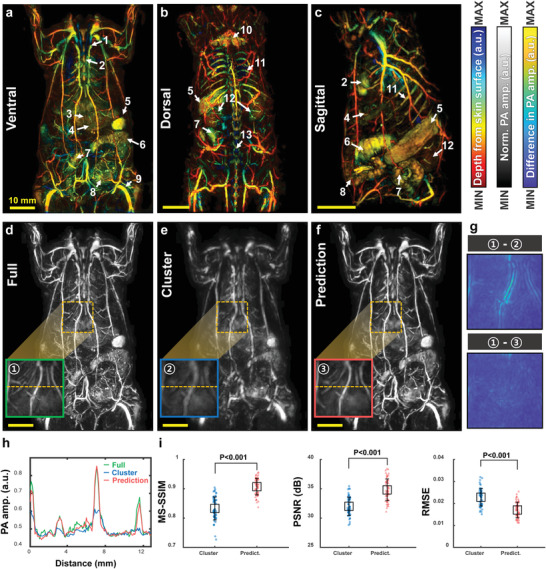
DL‐enhanced static whole‐body PA imaging of a rat in vivo. Whole‐body a) ventral, b) dorsal, and c) sagittal PA depth‐encoded images of a rat acquired with the full view (Movie S1, Supporting Information). Whole‐body ventral PA MAP images of a rat acquired with the d) full view, e) cluster view, and f) DL prediction (Movie S2, Supporting Information). Green, blue, and red boxes in (d–f) are close‐ups of single‐volume data from the orange dotted boxes in each image, respectively. g) PA images of the cluster‐view and prediction images subtracted from the full‐view image. h) Line profiles from the orange dotted lines in (d–f). i) Comparisons of the MS‐SSIM, PSNR, and RMSE of the cluster‐view and prediction images with respect to the full‐view images. All scale bars are 10 mm. Image labels: 1, sternum; 2, heart; 3, mesenteric artery; 4, liver; 5, spleen; 6, cecum; 7, small intestine; 8, large intestine; 9, popliteal vessel; 10, brown adipose tissue; 11, rib; 12, kidney; and 13, spine. MAP, maximum amplitude projection; MS‐SSIM, multi‐scale‐structural similarity index; PSNR, peak signal‐to‐noise ratio; and RMSE, root‐mean‐square error.
