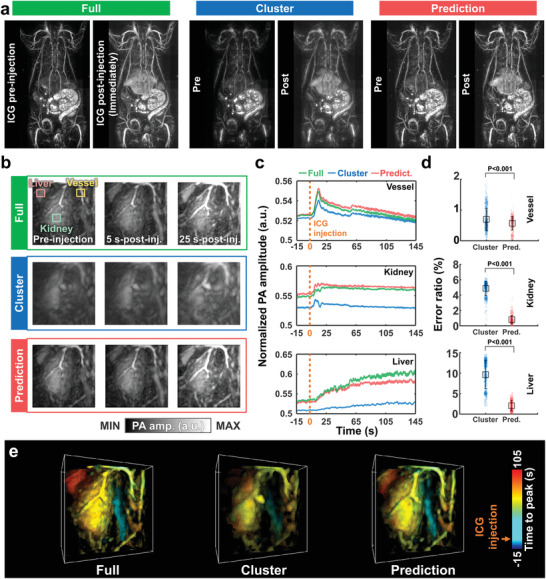
Figure 3.

DL‐predicted dynamic contrast‐enhanced PA images. a) Whole‐body ventral PA MAP images of a rat in vivo before and after ICG injection. b) PA MAP images of the kidney in the full view, cluster view, and DL prediction (Movies S3, Supporting Information). c) Time‐lapse PA signals in the liver, kidney, and vessel. d) Comparisons of the error ratios of the cluster‐view and prediction images to the full‐view image in the vessel, kidney, and liver. e) 3D time‐to‐peak images of ICG perfusion in the kidney with the full view, cluster view, and DL prediction.
