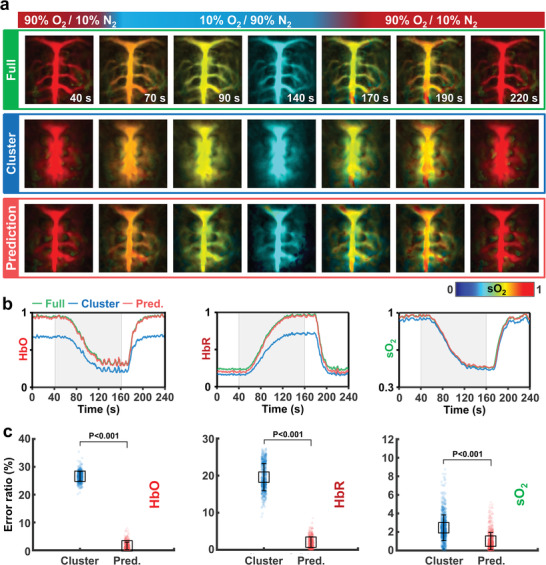
Figure 4.

DL‐enhanced dynamic functional PA neuroimaging of a rat in vivo. a) Representative PA sO2 MAP images of a rat's brain in vivo, showing the full view, cluster view, and DL prediction under an oxygen challenge (Movie S5, Supporting Information). b) Time‐lapse PA HbO, HbR, and sO2 signals. c) Comparisons of the error ratios of the cluster‐view and prediction HbO, HbR, and sO2 images to the full‐view image. HbO, concentration of oxy‐hemoglobin; HbR, concentration of deoxy‐hemoglobin; and sO2, hemoglobin oxygen saturation.
