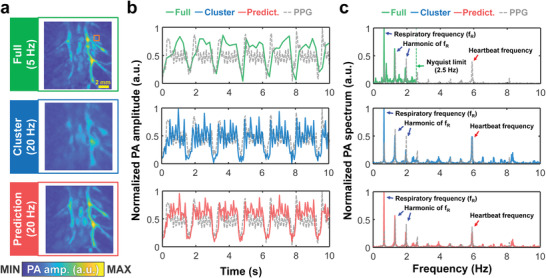
Figure 5.

DL‐enhanced physiological signal recording of a rat in vivo. a) PA MAP images of the heart in the full view, cluster view, and DL prediction (Movie S6, Supporting Information) b) Time‐lapse PA signals and PPG signals in the heart. c) The power spectrum of the (b).
