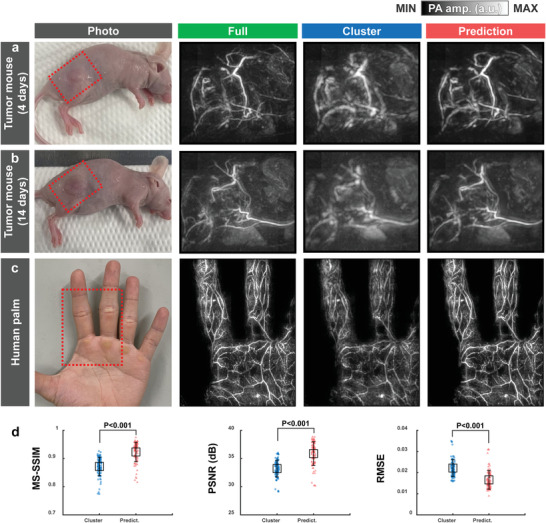
Figure 6.

DL‐enhanced static PA imaging of variable subjects in vivo. PA MAP images of a tumor‐bearing mouse on the a) 4 and b) 14 days after 4T1 tumor cell injection in the full view, cluster view, and DL prediction. c) PA MAP images of a human palm in the full view, cluster view, and DL prediction. d) Comparisons of the MS‐SSIM, PSNR, and RMSE of the cluster‐view and prediction images with respect to the full‐view images.
