. 2022 Dec 12;14(2):323–330. doi: 10.1039/d2sc06445f

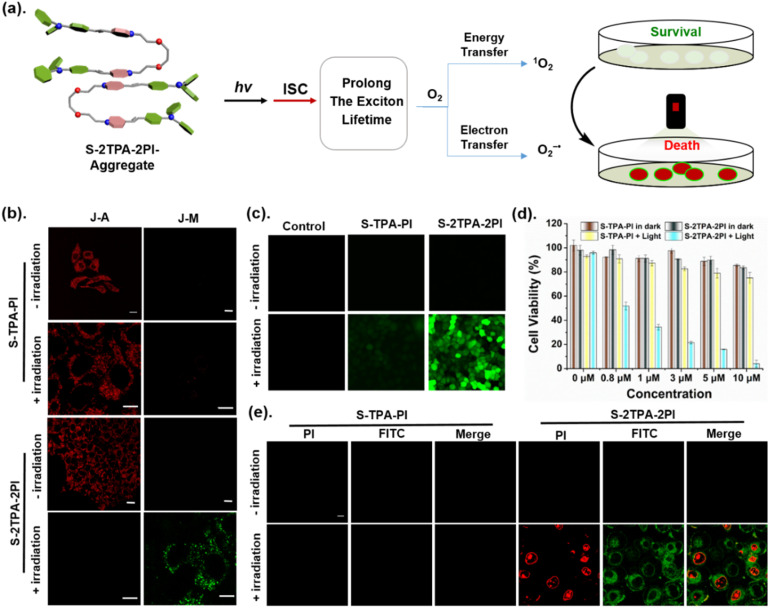
Fig. 5. (a) The schematic diagram of photogeneration of ROS and the suppressing effect on the cancer cell; (b) confocal images of HepG2 cells separately treated with S-2TPA-2PI or S-2TPA-2PI, followed by white light irradiation (400–700 nm, 50 mW cm−2) for 10 min and then incubated with JC-10 for 15 min and (c) DCFH-DA for 20 min; (d) the viabilities of HepG2 cells incubated with S-2TPA-2PI or S-2TPA-2PI at various concentrations without or with LED lamp irradiation for 10 min; (e). PI (2 μM) and FITC (5 μM) for 12 min (red channel: λex = 543 nm and λem = 600–660 nm and green channel: λex = 488 nm and λem = 500–560 nm). Scale bar: 20 μm.

Fig. 5