
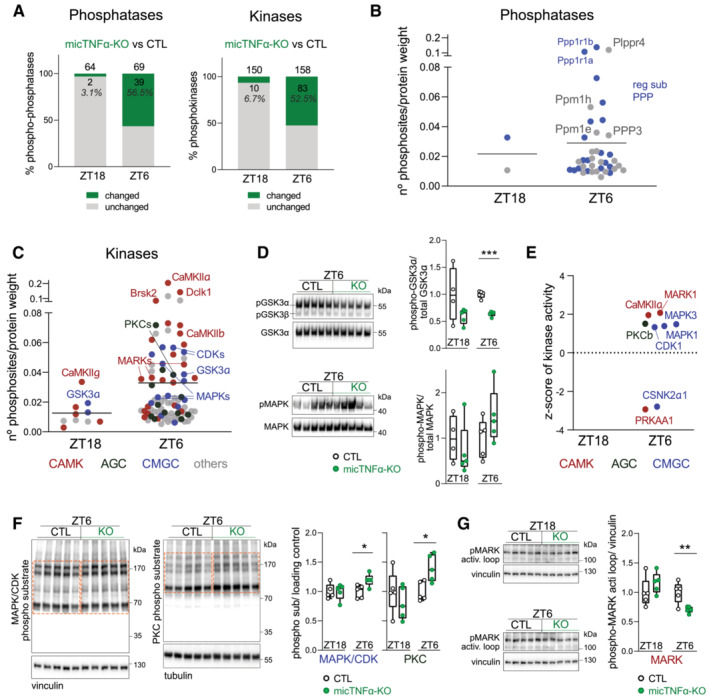
Figure 3. Kinases involved in microglial TNFα phosphomodulation during the light period.
-
APhosphomodulation of phosphatases and kinases by microglial TNFα. Graphs show the percentage of phospho‐phosphatases and phosphokinases with at least one changing phosphosite in micTNFα‐KO vs. CTL comparison (phosphosites with an adjusted P‐value ≤ 0.05 and unique phosphosites) at ZT18 and ZT6.
-
B, CThe density of phosphosites on (B) phosphatases and (C) kinases modulated by microglial TNFα at ZT18 and ZT6. Graphs show the number of significantly changed phosphosites in micTNFα‐KO vs. CTL comparison per protein weight. Each dot is one phosphoprotein. (B) Phosphatases are shown in gray. Regulatory subunits of phosphoprotein phosphatases (reg sub PPP) in blue. (C) Kinases are color‐coded according to the major families: calcium/calmodulin‐regulated kinases (CAMK, red); CDK, MAPK, GSK3, and CLK kinases families (GMGC, blue); protein kinase A, G, and C families (AGC, dark green); and kinases belonging to other families (others, gray).
-
DValidation by western blot of changes in specific phosphorylation events on kinases. Left, Immunoblots of cortical lysates of CTL and micTNFα‐KO at ZT6 for: (top) phosphorylated GSK3α/β (pGSK3α at Ser21 and pGSK3β at Ser9) and total GSK3α; and (bottom) phosphorylated MAPK (pMAPK and MAPK3 at Thr203/Tyr205 and MAPK1 at Thr183/Tyr185) and total MAPK. Right, Ratio between phosphorylated and total kinase normalized to CTL at ZT18 and ZT6. Immunoblots at ZT18 in Appendix Fig S5C. n = 5 mice per group. ***P = 0.000009 (GSK3α), multiple t‐test with Benjamini–Hochberg correction.
-
EKinases with altered activity between CTL and micTNF‐KOs predicted by robust kinase activity inference (RoKAI) at ZT18 and ZT6. The graph shows the z‐score value of each kinase assigned by RoKAI. Kinases above and below the dotted line represent the prediction of up‐ and downregulated activity in micTNFα‐KO, respectively. Kinases are color coded according to the kinase group as described in (C).
-
F, GValidation by western blot of altered activity of predicted kinases between CTL and micTNF‐KOs. (F) Left, Immunoblots of cortical lysates of CTL and micTNFα‐KO at ZT6 using antibodies specific to target phosphorylation motifs of MAPK/CDK (PXS*P, S*PX(K/R)) and PKC ((K/R)XS*X(K/R)). Dashed boxes indicate quantified signals. Right, Ratio between phosphorylated substrates and loading control normalized to CTL at ZT18 and ZT6. Immunoblots at ZT18 in Appendix Fig S5D. (G) Left, Immunoblots show signal of phosphorylated threonine in MARKs activation loop. Right, Ratio between phosphorylated MARK activation loop and loading control normalized to CTL at ZT18 and ZT6. (F, G) n = 5 mice per group. *P = 0.022 (MAPK/CDK phospho‐sub), *P = 0.014 (PKC phospho‐sub), and **P = 0.0091 (MARK), multiple t‐test with Benjamini–Hochberg correction.