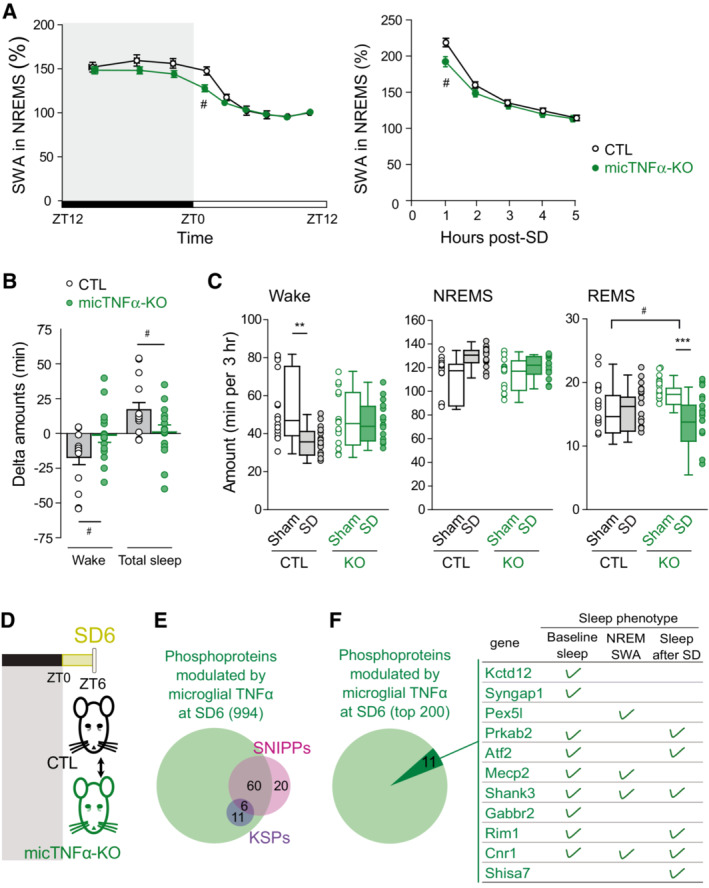
Time course of SWA during NREM sleep across a 24 h baseline sleep–wake cycle (left) and in the first 5 h after sleep deprivation (SD; right) in controls CTL (black) and micTNFα‐KO (green) mice. Mean SWA values normalized to the mean SWA during ZT8 to ZT12 of the baseline recording, a period during which sleep need is lowest (see Methods). SWA in baseline sleep: CTL, 14 mice; micTNFα‐KO, 15 mice. Two‐way rANOVA; genotype, F(1,27) = 2.170, P = 0.1523; time: F(3.003,81.09) = 117.8, P < 0.0001; interaction F(8,216) = 2.257, P = 0.0246; SWA after sleep deprivation: CTL, 12 mice; micTNFα‐KO, 15 mice. Two‐way rANOVA; genotype, F(1,25) = 1.902, P = 0.1801; time: F(2.489,62.23) = 415.8, P < 0.0001; interaction F(4,100) = 4.196, P = 0.0035. Post hoc test with Sidak's multiple‐comparisons tests, #
P < 0.05 CTL vs. micTNFα‐KO.
Wake, NREM sleep, and REM sleep amounts in the first 3 h of the recovery phase after sleep deprivation (SD, plain) or sham condition (Sham, empty) in CTL and micTNFα‐KO mice. SD: mice were sleep deprived for 6 h starting at ZT0; Sham condition: each mouse was gently awakened at ZT6, 2 days prior to the SD procedure (matched control recording). CTL, 15 mice; micTNFα‐KO, 15 mice. Data are represented as mean ± SEM. Two‐way rANOVA; wake: genotype, F(1,28) = 0.5302, P = 0.4726; SD: F(1,28) = 5.863, P = 0.0222; interaction F(1,28) = 6.105, P = 0.0198; NREM sleep, F(1,28) = 0.7292, P = 0.4004; SD: F(1,28) = 11.40, P = 0.0022; interaction F(1,28) = 2.657, P = 0.1143, REM sleep, F(1,28) = 0.2423, P = 0.6264; SD: F(1,28) = 8.273, P = 0.0076; interaction F(1,28) = 12.91, P = 0.0012. Post hoc test with Sidak's multiple‐comparisons tests, **P < 0.01 and ***P < 0.001 Sham vs. SD and #
P < 0.05 CTL vs. micTNFα‐KO.

