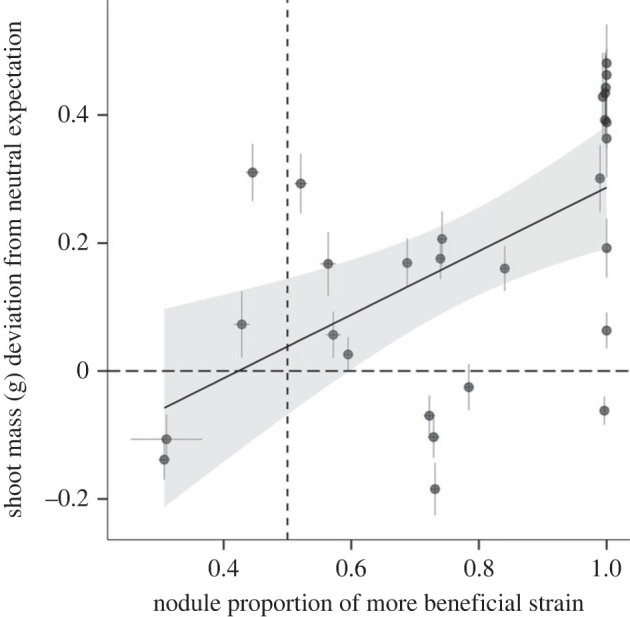
Figure 3.

Stronger partner choice yields greater plant fitness across 28 symbiont pairs. Filled circles, mean shoot mass deviation from the expected benefit to the host shoot mass under a neutral expectation (long dashed line) for two-strain inocula. Vertical dashed line, the nodule proportion (0.5) corresponding to no partner choice. Horizontal dashed line, the neutral expectation for host fitness under no partner choice. Black line, linear regression. Grey shading, 95% confidence interval. (Online version in colour.)
