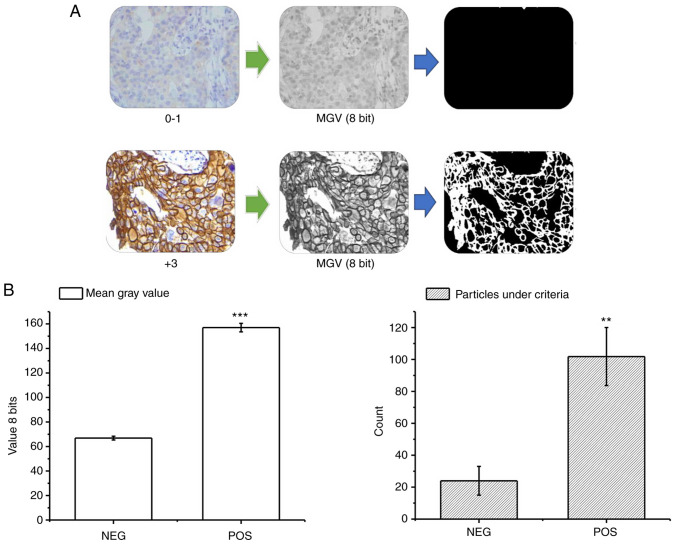
Figure 2.
Results of automated image analysis in control cases. (A) Representative images of the results of the automatic analytical procedure in the negative controls (top, 0–1) and positive controls (bottom, +3). The original image was decomposed into the total signal and the binary mask of the circular spaces, which then showed the substantial differences between the two groups. (B) Graphs of the quantification in the controls (positive and negative) of the MGV (left) and the particle count of interest (right). Data are presented as the mean ± SD. **P<0.01, ***P<0.001. n=30. MGV, mean grey value.

