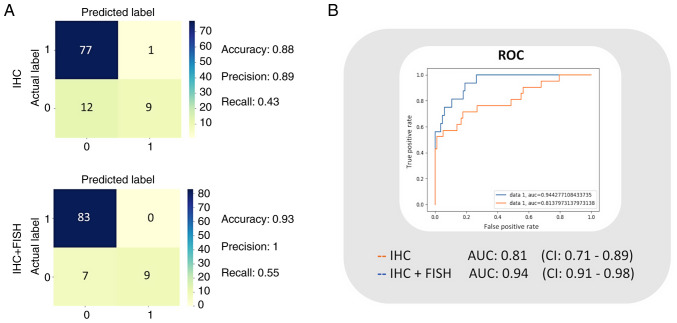
Figure 3.
Classification model of the performance metrics. (A) Confusion matrices for the IHC vs. IHC + FISH classifier models and the resulting best accuracy, precision, and recall. (B) ROC analysis and graphical representation of the AUC for the two models. The intervals are adjusted to 95% confidence. n=20. IHC, immunohistochemistry; FISH, fluorescence in situ hybridization; ROC, receiver operating characteristic; AUC, area under the curve.

