Fig. 2.

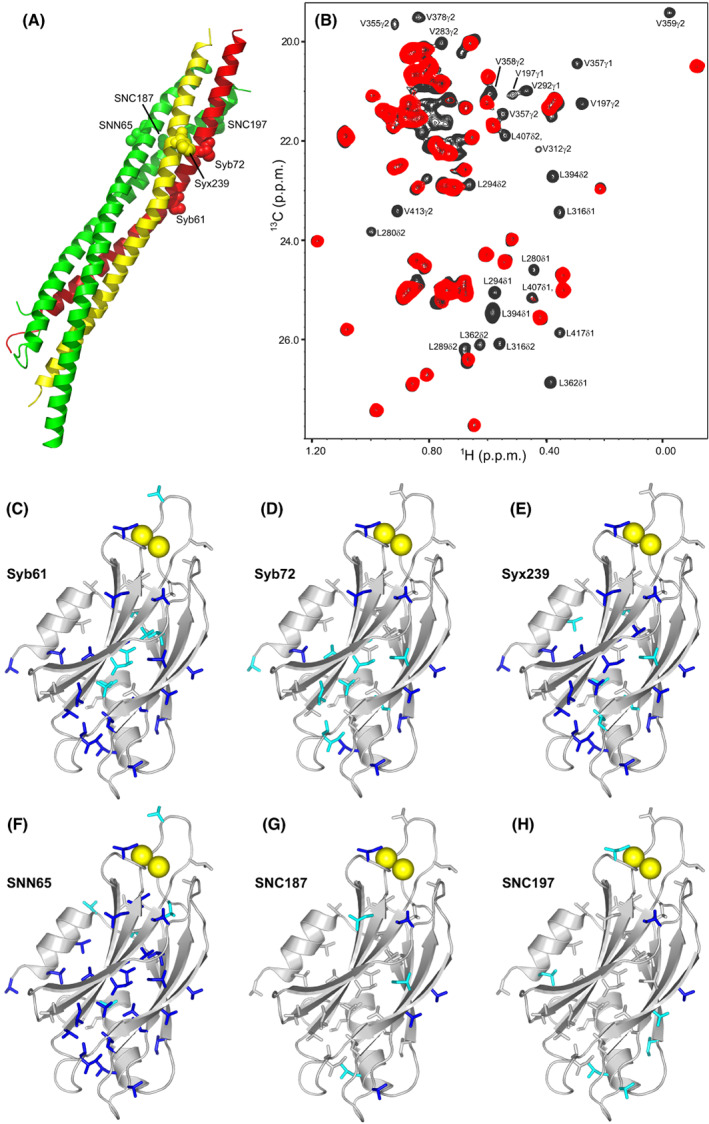
PRE analysis of Syt1 C2AB binding to the C‐terminal half of the SNARE complex. (A) Ribbon diagram of the SNARE complex (synaptobrevin in red, syntaxin‐1 in yellow, and SNAP‐25 in green) showing the locations of residues that were mutated to cysteine for labeling with MTSL. SNN and SNC refer to the N‐ and C‐terminal SNARE motifs of SNAP‐25, respectively. (B) 1H‐13C HMQC spectra of 15 N‐2H–ILV‐13CH3–labeled Syt1 C2AB in the presence of SNARE complex bearing an MTSL probe on residue 65 of SNAP‐25 before (red contours) and after (black contours) reduction of the MTSL probe. The residues corresponding to selected cross‐peaks exhibiting strong PREs are labeled. (C–F) ribbon diagrams of the Syt1 C2B domain (light gray) showing the methyl‐containing side chains that exhibit PREs smaller than 0.4 as blue sticks and those exhibiting PREs between 0.4 and 0.6 as cyan sticks in 1H‐13C HMQC experiments performed with 15 N‐2H–ILV‐13CH3–labeled Syt1 C2AB and SNARE complex tagged with MTSL at residue 61 or 72 of synaptobrevin (Syb61 and Syb72, respectively) (C, D), residue 239 of syntaxin‐1 (Syx239) (E), or residue 65, 187 or 197 of SNAP‐25 (SNN65, SNC187, and SNC197, respectively) (F–H). Bound Ca2+ ions are shown as yellow spheres for illustrative purposes, but note that the experiments were performed in the absence of Ca2+.
