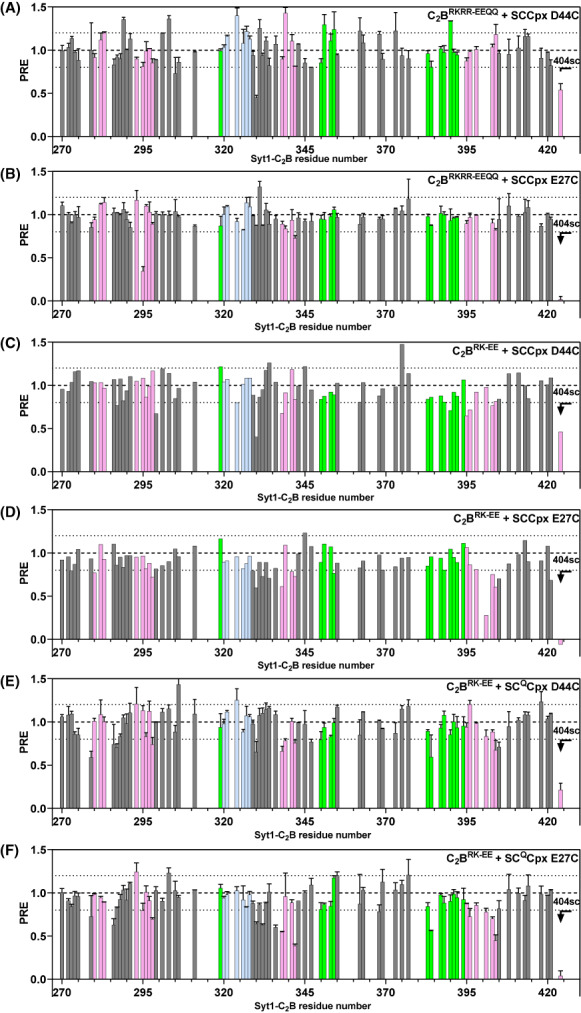
Fig. 6.

PREs observed in the analysis of potential tripartite Syt1‐SNARE‐complexin‐1 complexes. The panels show bar diagrams of PREs versus residue number that was calculated from 1H‐15 N TROSY‐HSQC spectra of 20 μm 15 N,2H‐labeled C2BRKRR‐EEQQ (A, B) or 15 N,2H‐labeled C2BRK‐EE (D–F) in the presence of 110 μm MTSL‐labeled SCCpx D44C (A, C), SCCpx E27C (B, D), SCQCpx D44C (E), or SCQCpx E27C (F) by dividing the intensity observed before reduction by the intensity observed after reduction. PREs observed for the W404 side chain NH group are shown on the right. The bars are colored in pink for residues from the primary interface, light blue for residues from the polybasic interface, and green for residues from the tripartite interface. Dashed lines serve as references for PRE = 0.8 and 1.2. Error bars indicate standard deviations for experiments that were performed in duplicate.
