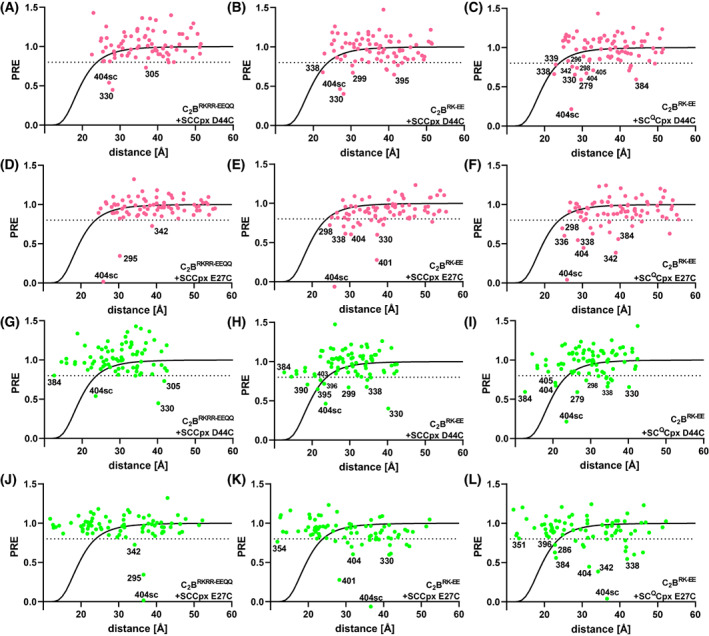
Fig. 7.

PRE analyses based on the crystal structures that revealed the primary and tripartite interfaces. The graphs show plots of the PREs observed in 1H‐15 N TROSY‐HSQC spectra of 20 μm 15 N,2H‐labeled C2BRKRR‐EEQQ (A, D, G, J) or 15 N,2H‐labeled C2BRK‐EE (B, C, E, F, H, I, K, L) in the presence of 110 μm MTSL‐labeled SCCpx D44C (A, B, G, H), SCCpx E27C (D, E, J, K), SCQCpx D44C (C, I), or SCQCpx E27C (F, L) versus the distance from the corresponding nitrogen atom to the estimated position of the MTSL probe predicted if binding occurs through the primary interface (A‐F) or the tripartite interface (G–L). PDB accession numbers 5kj7 and 5w5c were used to predict the distances corresponding to the primary interface and the tripartite interface, respectively. Selected PREs below 0.8 are labeled in each plot to illustrate particular points discussed in the text.
