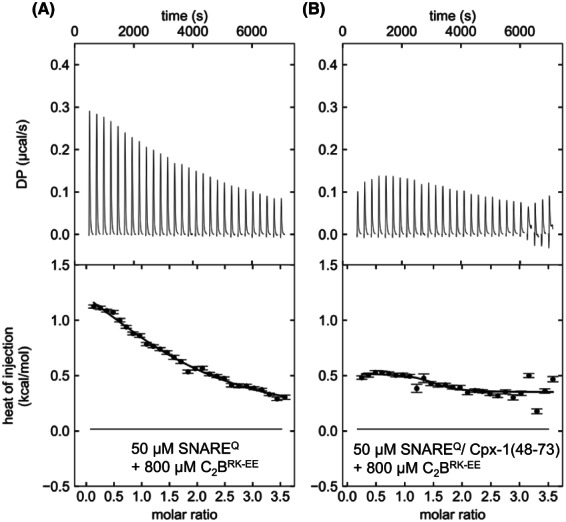
Fig. 8.

ITC analysis of interactions between C2BRK‐EE and SNAREQ. The panels show titrations of 50 μm SNAREQ (a) or SNAREQ/Cpx1(48‐73) (B) with 800 μm C2BRK‐EE monitored by ITC. The upper panels show the baseline‐ and singular‐value‐decomposition‐corrected thermograms for the respective experiments. The circles in the lower panels are the integrated heats of injection, with the error bars representing estimated errors for these values.
