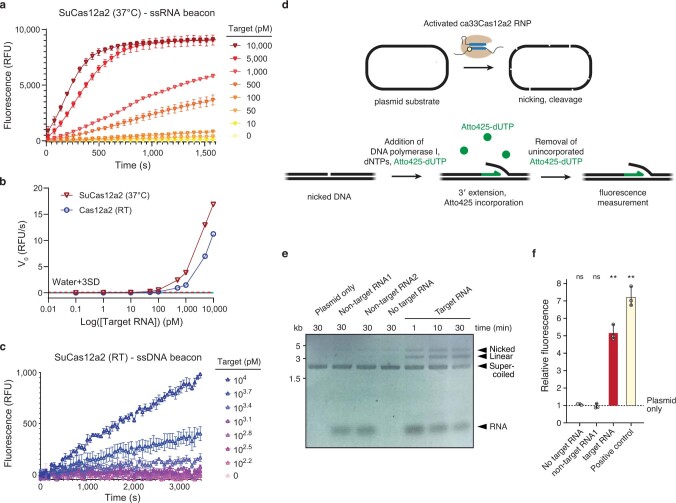
Extended Data Fig. 10. Assessment and extension of Cas12a2-based diagnostics.
a, Progress curve for target RNA-activated cleavage of RNA beacon by SuCas12a2 at 37 °C. b, Limit of detection of SuCas12a2 using an RNA beacon as determined using the velocity method46. Velocities were obtained by regression analysis of the linear regions of the progress curves. The velocity method was used to determine all reported limits of detection. c, Progress curve for target RNA-activated cleavage of ssDNA beacon by Cas12a2 at ambient temperature (RT). Error bars in a and c represent the mean and standard deviation of three independent measurements. Error bars in b represent the standard error for the linear fit of three independent measurements. d, Overview of detection assay based on plasmid nicking and nick translation. e, Resolved plasmid substrate incubated with the ca33Cas12a2-gRNA RNP (100 nM) and the indicated RNA (1 nM). The incubation time before initiating nick translation is indicated for each experimental condition. The first lane (Plasmid only) represents the plasmid incubated without an RNP. Non-target RNA1: COA1 gRNA and SARS-CoV-2 RNA. Non-target-RNA2: SARS-CoV-2 gRNA and COA1 RNA. f, Fluorescence measurements following nick translation with the different reactions from e. Fluorescence values were normalized to that of the plasmid-only control. For the positive control, the plasmid was subjected to a mix of DNase I and DNA polymerase I. Values are means ± s.d. of 3 independent experiments. Significance was calculated using two-tailed Welch’s t-test compared to a value of 1 (ns: p > 0.05, *: p < 0.05, **: p < 0.005). For gel source data, see Supplementary Fig. 1.

