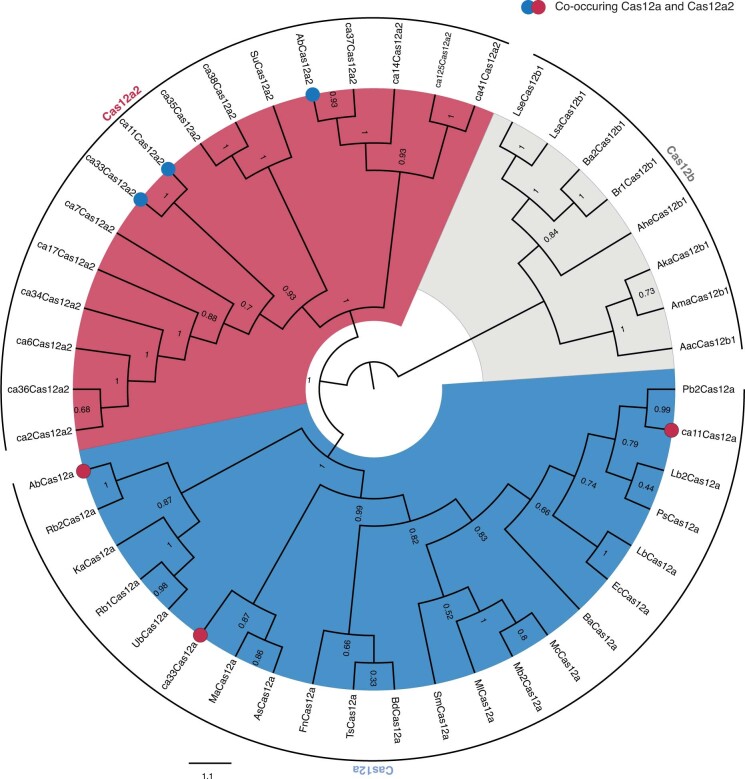
Extended Data Fig. 1. Maximum-likelihood phylogeny of Cas12a2 and Cas12a nucleases, with Cas12b as an outgroup.
The phylogenetic tree generated using amino acid sequences is the annotated version of Fig. 1a. The shaded regions designate Cas12a2 (red), Cas12a (blue), and Cas12b (grey) orthologues. The blue and red filled circles indicate systems that contain both Cas12a2 and Cas12a. Transfer bootstrap expectation (TBE) values are shown at the nodes.

