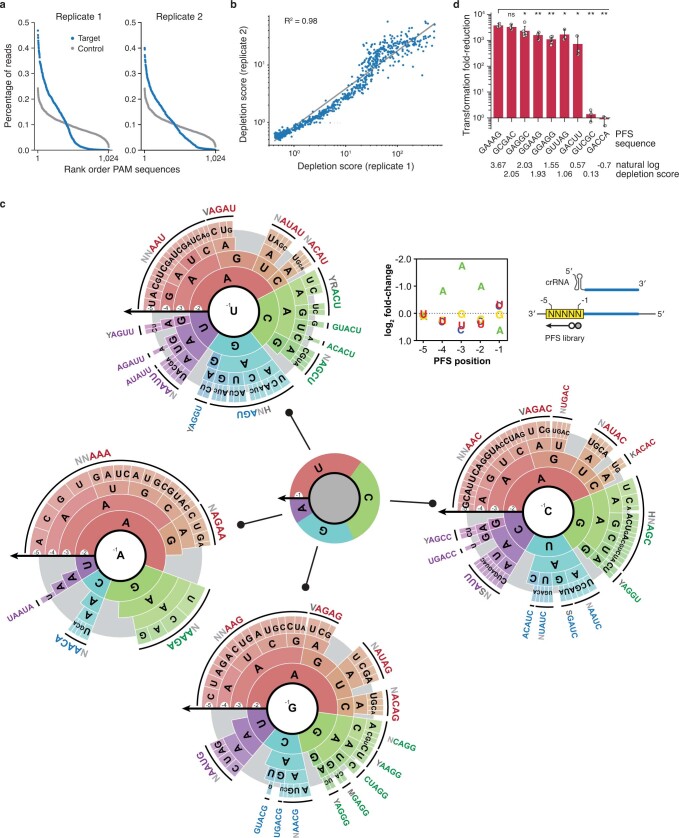
Extended Data Fig. 5. PFS depletion screen with SuCas12a2 in E. coli BL21(AI).
a, Sequencing coverage of the PFS libraries from the target and the control E. coli cultures. Data from two biological replicates are shown. b, Correlation between the depletion scores obtained from the two replicate libraries. c, The complex PFS profile recognized by SuCas12a2. See ref. 65 for more information on interpreting PAM wheels. Given the complexity of the PFS profile, four different PAM wheels are shown based on each nucleotide at the −1 PFS position. d, Validation of selected PFS sequences identified in the PFS screen with SuCas12a2 using the plasmid clearance assay. Values are means ± s.d. of ≥ 3 independent experiments started from separate colonies. ns: p > 0.05, *: p < 0.05, **: p < 0.005 calculated with one-tailed Welch’s t-test.

