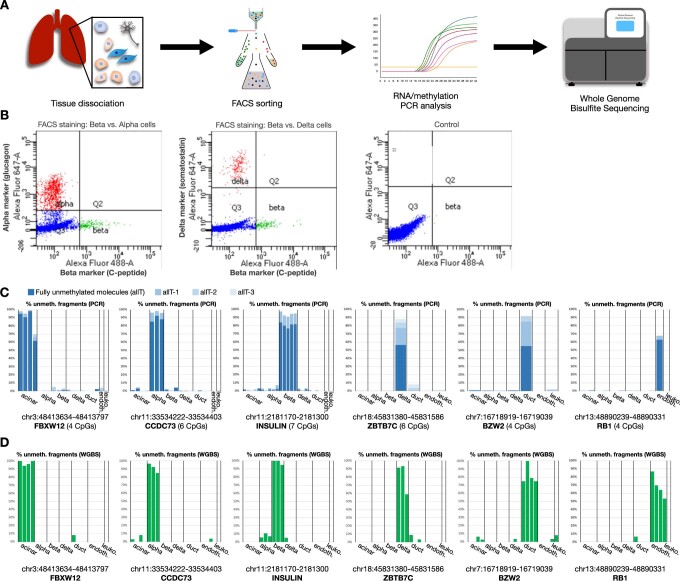
Extended Data Fig. 2. Sample preparation and purity.
(A) Fresh tissue was obtained at surgery and dissociated (optimized per tissue type), then incubated with antibodies, and FACS-sorted. Sorted cells were analysed using qRT-PCR for key cell-type-specific genes, or targeted PCR for cell-type-specific DNA methylation markers.DNA methylation was also analysed using whole-genome bisulfite sequencing. (B) Example of FACS sorting for pancreatic endocrine cell types. Left panel: staining for the beta cell marker C-peptide (x-axis) versus alpha cell marker glucagon (y-axis). Note that no double positive cells are observed. Centre panel: staining for c-peptide (x-axis) versus delta cell marker somatostatin (y-axis). Right panel: unstained control (only fluorescent secondary antibodies added, no primary antibodies). (C) Fragment-level validation of sample purity using targeted PCR. Cell-type-specific markers were designed using pre-existing 450K data, covering 4–7 several neighbouring CpGs. Shown is the percentage of unmethylated molecules in each cell type (including endothelial cells and leukocytes). Colour gradient fades from fully unmethylated molecules (allT), through those unmethylated in all but one CpG (allT-1), etc. Amplicon locations are reported in hg19, for acinar cells, alpha, beta, delta, duct, and endothelial markers (from left to right). (D) Fragment-level validation of the same locations, using the atlas WGBS data. Y-axis marks the percentage of unmethylated fragments (with ≥4 CpGs). As these markers show, approximately 90% of molecules in that target cell type are unmethylated, compared with less than 5% in other cell types, thus emphasizing the purity of the DNA methylation atlas using a set of independently selected DMRs.

