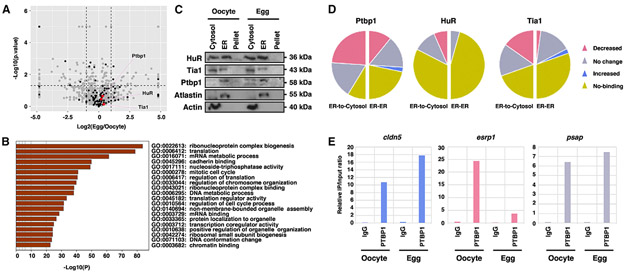
Figure 5. Roles of ER-associated RBPs in regulating mRNA-ER association during oocyte maturation.
(A) Volcano plot shows the proteomic profiling ofmicrosomes purified from oocytes and mature eggs. Differentially expressed proteinswere defined asap value lessthan 0.05 (dashed horizontal line) and greater than a 2-fold difference between oocyte and egg (dashed vertical lines) (gray dots, whole 1,976 proteins; black dots, RBPs). All-proteomic profile was performed on biologically independent triplicated samples.
(B) Bar graph shows gene ontology (GO) enrichment analysis of ER-associated proteins that remain unchanged during oocyte maturation. This analysis was performed by Metascape.
(C) Western blot shows the expression of RBPs (Ptbp1, HuR, and Tia1) in cytosolic, ER, and pellet fractions in the oocyte and mature egg. Atlastin and Actin were enriched in the ER and cytosolic fractions, respectively.
(D) Pie charts show the summary of RIP assays. In all three RIP assays, 23 transcripts in the oocyte-ER/egg-ER groups and 23 transcripts in the oocyte-ER/egg-cytosol groups were analyzed (pink, the proportion of mRNAs with decreased binding; gray, the proportion of mRNAs with no change; blue, the proportion of mRNAs with increased binding; yellow, the proportion of mRNAs not bound by RBPs).
(E) Bar graphs are Ptbp1-RIP of cldn5, esrp1, and psap, which are shown as representative results of the increased, decreased, and unchanged categories, respectively.

