. 2023 Jan 4;131(1):017001. doi: 10.1289/EHP10611

Figure 2.

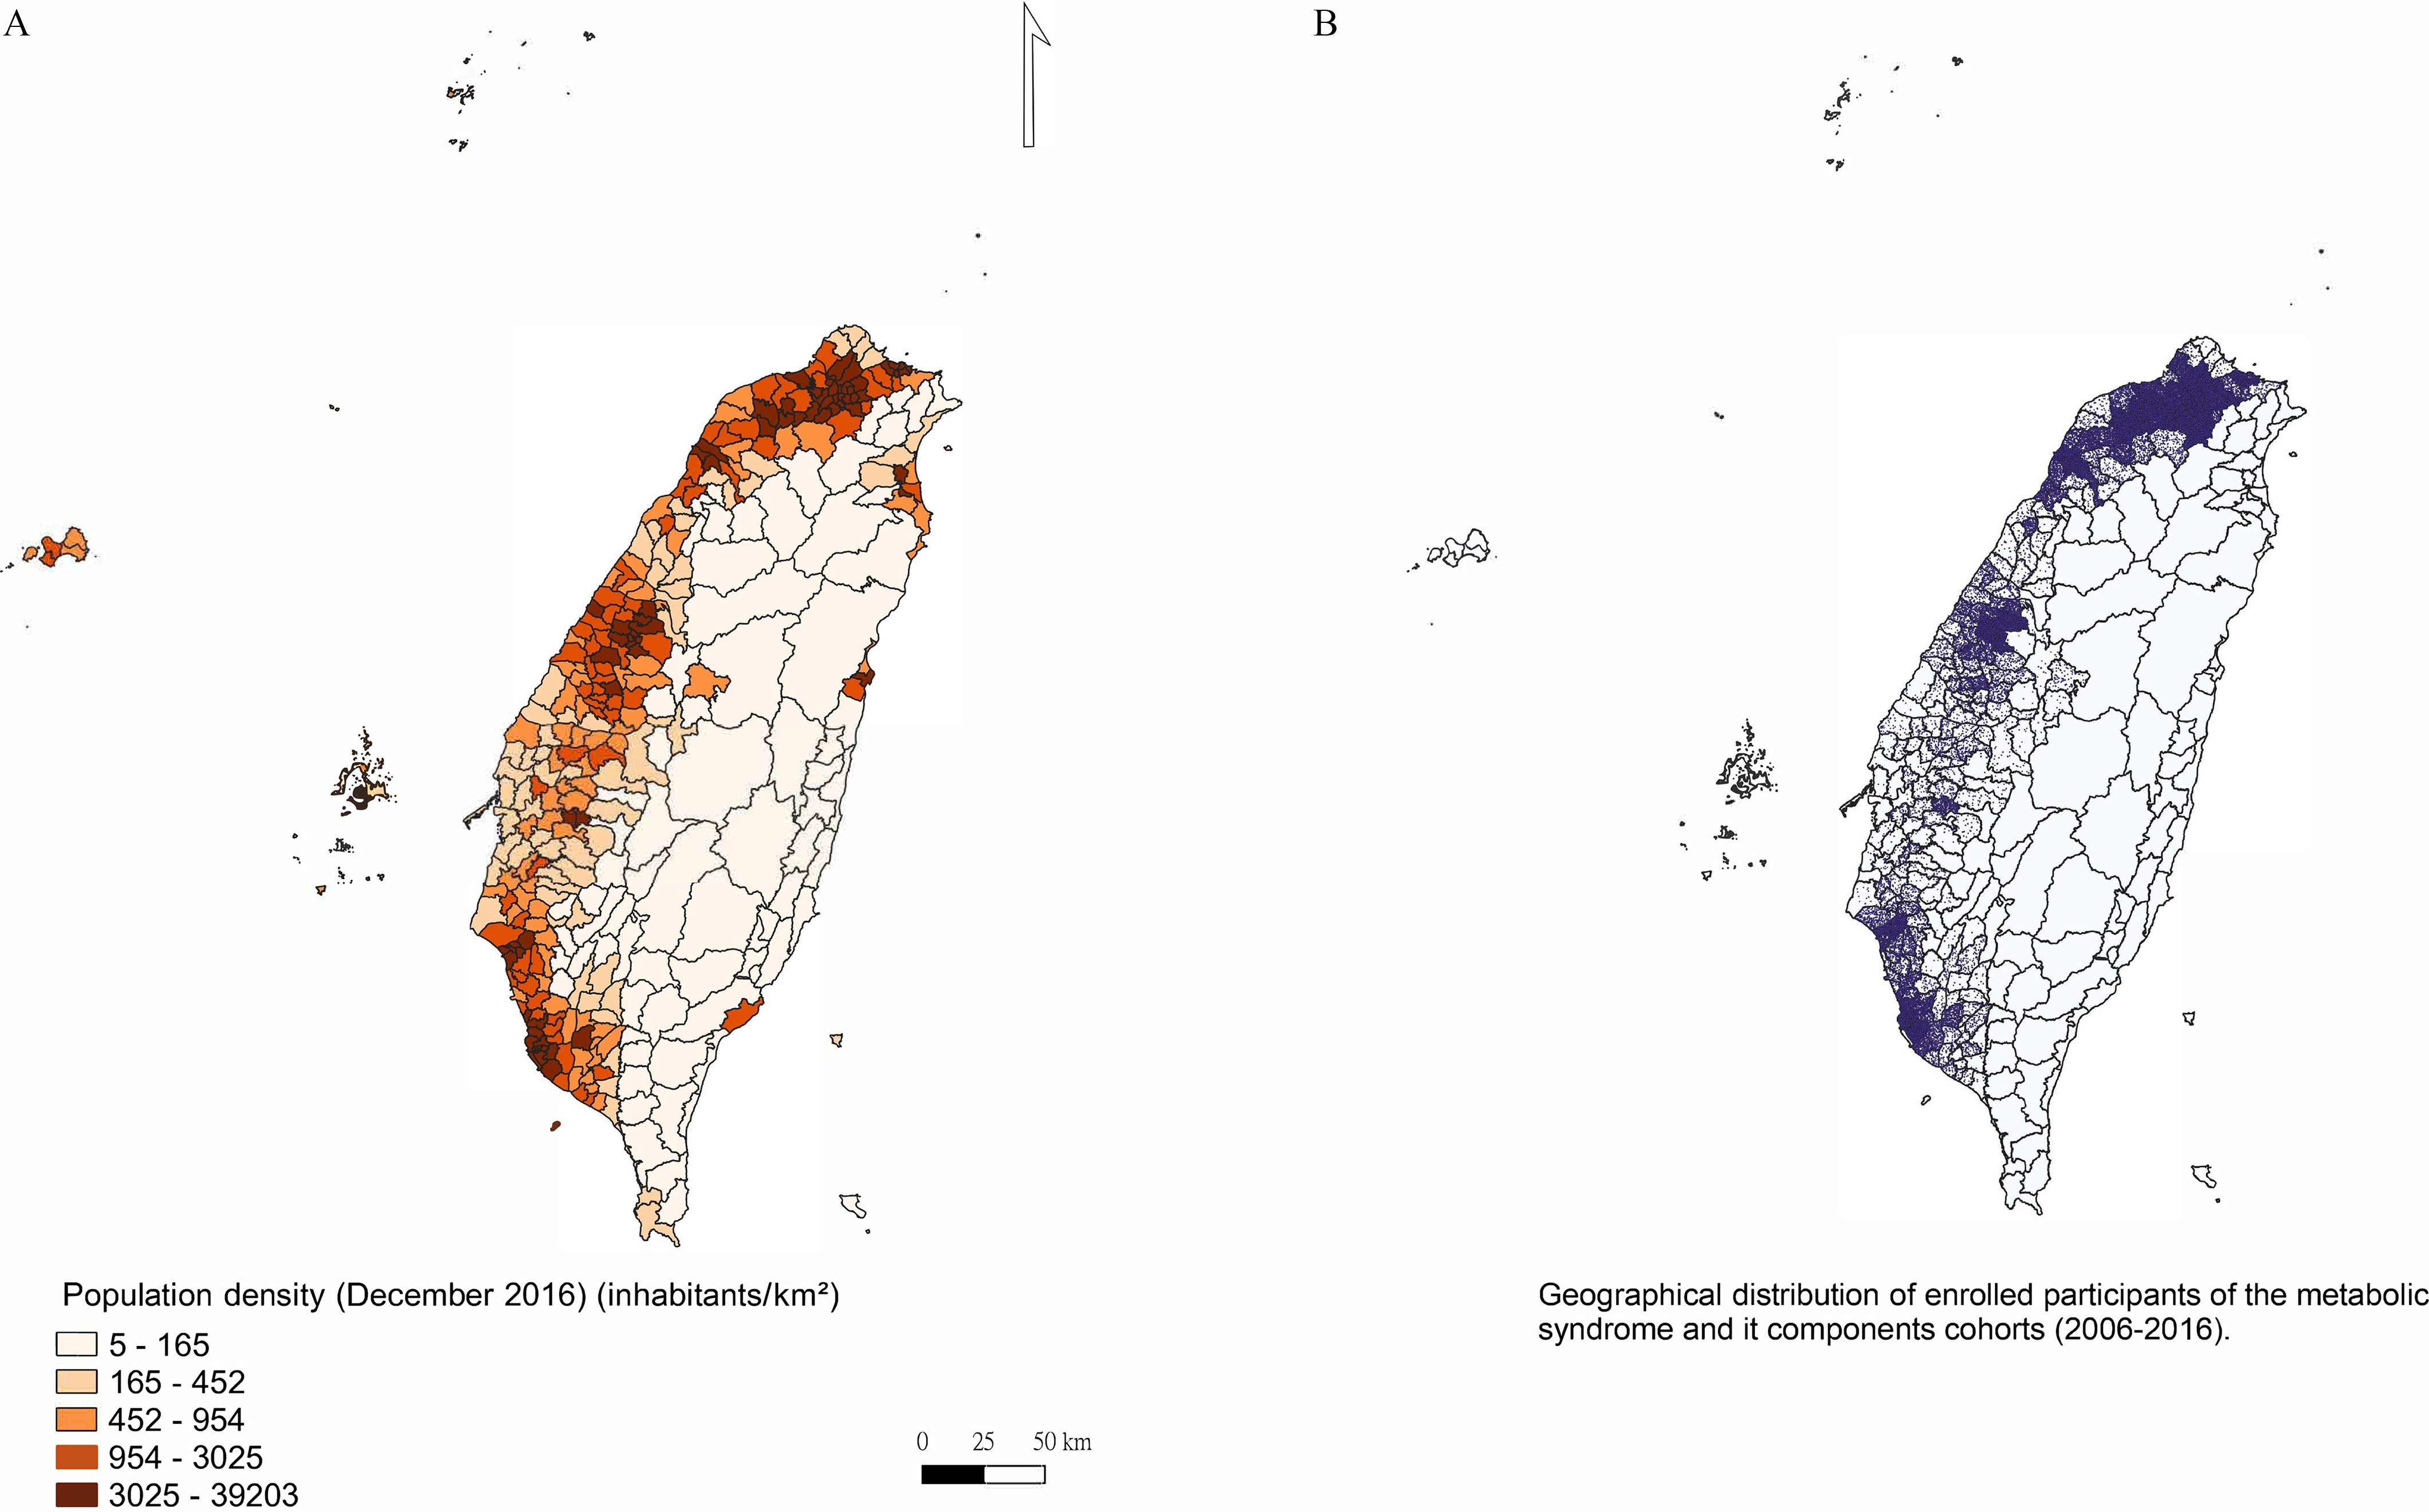
Figures 2A and 2B are maps of Taiwan. Figure 2A depicts the geographical distribution of population density in Taiwan in December 2016. The density of inhabitants per kilometer squared is divided into five categories, namely, 5 to 165, 165 to 452, 452 to 954, 954 to 3,025, and 3,025 to 39,203. Figure 2B depicts the geographical distribution of enrolled participants in the metabolic syndrome and its component cohorts from 2006 to 2016. Each dot represents one participant. A scale depicts the distance in kilometers, ranging from 0 to 50 in increments of 25.

Geographical distributions of population density in Taiwan (N=23,539,816), and the participants of the metabolic syndrome and its components cohorts (N=93,771). The area of Taiwan is 36,000km2,44 with a population of 23.5 million people.45 (A) Population density. (B) General distribution of enrolled participants; each dot represents one participant. The small, outlined areas represent townships. This figure was created using the QGIS Desktop software (version 3.22; Open Source Geospatial Foundation).