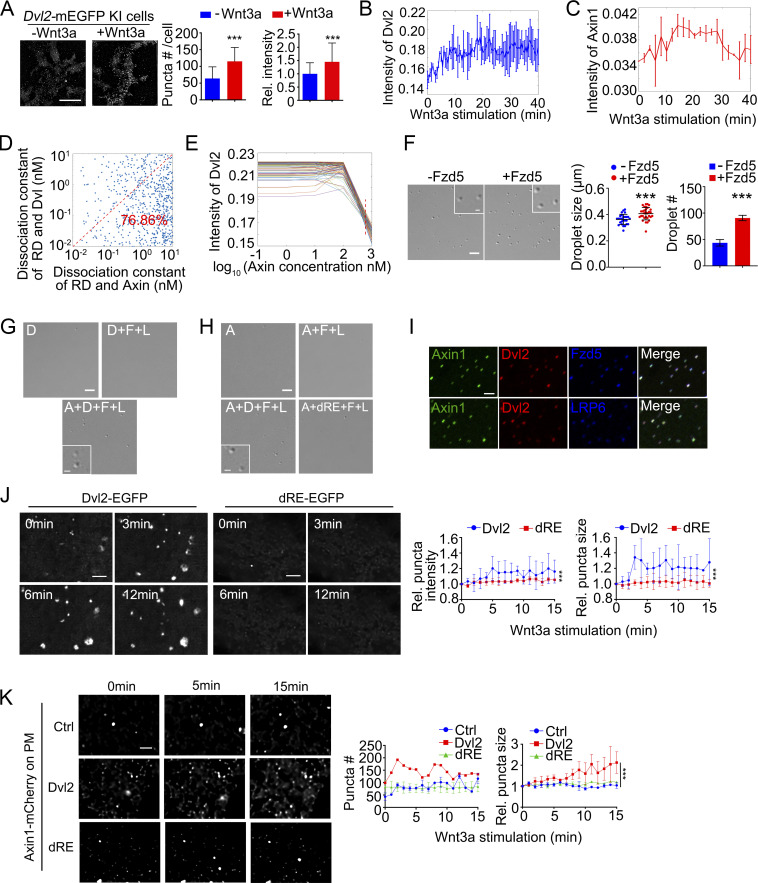
Figure 2.
Dvl2 LLPS is crucial for signalosome organization. (A) TIRF-SIM images of Dvl2-mEGFP-KI cells with or without Wnt3a stimulation. The puncta number was counted from three independent cells. The relative intensity of membrane-associated Dvl2-mEGFP puncta was normalized to the group without Wnt3a treatment. (B and C) The average intensity of membrane-associated Dvl2-mEGFP (B) and Axin1-tdTomato (C) puncta detected by TIRF-SIM. (D) The dissociation constant of RD (Wnt receptor/Dvl2 complex) and Dvl versus dissociation constant of RD and Axin. Scatter plot comparing dissociation constant of solutions that fit the experimental dynamic averaged Dvl2 intensity data. (E) Average intensity of Dvl puncta from the 106 fitted modeling solutions at different concentration of Axin. The ODE modeling was solved at the time interval of 20 min after Wnt3a treatment; red dash line marked the absolute total Axin level of 590 nM in the cell. (F) Formation of 0.5 µM Dvl2 droplets with or without 0.5 µM purified Fzd5 C-terminal fragment (522–585aa). Droplet formation was induced with 10% PEG8000. (G and H) Formation of droplets by mixtures containing 0.2 μM of the indicated components with 10% PEG8000. D: Dvl2; A: Axin1; F: Fzd5 C-terminal fragment; L: LRP6 C-terminal fragment; dRE: Dvl2(dRE). (I) Labeled Axin1, Dvl2, Fzd-C-terminal fragment, and unlabeled LRP6-C-terminal fragment were mixed (0.5 µM each) for LLPS assay (top row); labeled Axin1, Dvl2, LRP6-C-terminal fragment and unlabeled Fzd5-C-terminal fragment were mixed (0.5 µM each) for LLPS assay (bottom row). (J) Dvl1/2/3 KO HEK293T cells expressing Dvl2-EGFP or Dvl2(dRE)-EGFP were treated with Wnt3a stimulation. Quantification data showing the size and intensity of membrane-associated puncta detected by TIRF-SIM. The data were normalized to that in 0 min. (K) Axin1-mCherry was expressed alone or with untagged Dvl2-EGFP or Dvl2(dRE)-EGFP in Dvl1/2/3 KO HEK293T cells with Wnt3a stimulation. Quantification data showing the size of membrane-associated puncta detected by TIRF-SIM. The data corresponding to other time points were normalized to that in 0 min. Statistical analyses were performed with the two-tailed unpaired t test. Data in A, F, J and K are shown as mean ± SD (n = 3). ***, P < 0.001. Scale bars in A, 10 µm; in F, G, H and I, 2 µm; in J and K, 5 µm; and insets in F, G, and H, 0.5 µm.

