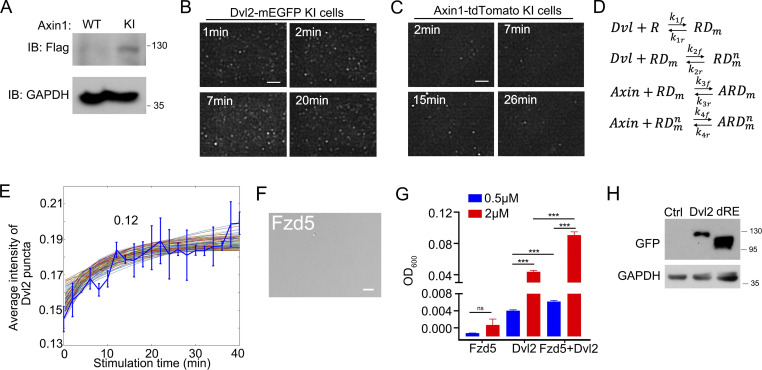
Figure S2.
Visualizing the endogenous signalosome assembly process at the single-molecule level by TIRF. (A) Validation of Axin1-Flag-tdTomato KI HEK293T cells (Axin1-tdTomato KI cells) by immunoblotting. (B) Time-lapse TIRF-SIM images showing the membrane localization of Dvl2 puncta in Dvl2-mEGFP KI cells under Wnt3a stimulation. (C) Time-lapse TIRF-SIM images showing membrane localization of Axin1 puncta in Axin1-tdTomate KI cells under Wnt3a stimulation. (D) The binding interactions between the Wnt receptor (R), Dvl, and Axin for signalosome formation. RD, receptor-Dvl complex; ARD, Axin-receptor-Dvl complex. m represents the Dvl on the membrane, and n represents multiple Dvl in the system. (E) Average intensity of Dvl2-mEGFP puncta compared to the constrained and fitted well modeling solutions. (F) DIC images of 0.5 μM purified intracellular domain of Fzd5 (522–585aa) that were induced with 10% PEG8000. (G) Turbidity of purified Dvl2 (0.5 μM, 2 μM) with or without the same concentrations of intracellular domain of Fzd5 (0.5 μM, 2 μM) induced be 10% PEG8000. (H) Dvl2 WT and dRE have the similar expression in cells. The expression level of Dvl2 WT and dRE was detected with immunoblotting. Statistical analyses were performed with the two-tailed unpaired t test. Quantification data are shown as mean ± SD (n = 3). ***, P < 0.001. Scale bar in F, 2 µm. Source data are available for this figure: SourceData FS2.

