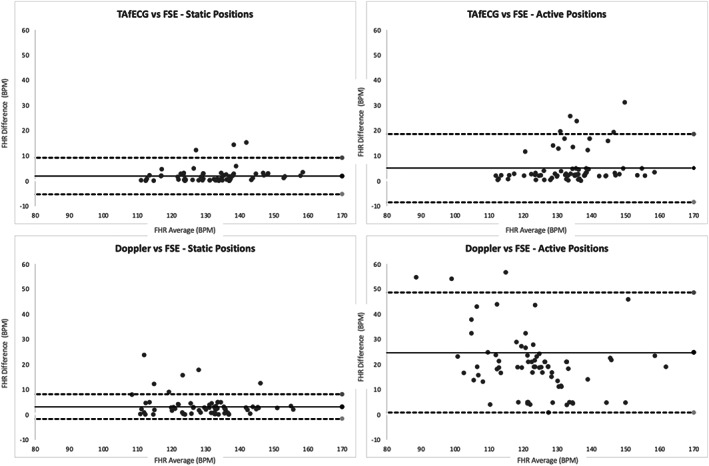
FIGURE 2.

Bland–Altman plots and limits of agreement between transabdominal fetal electrocardiography (TAfECG) and fetal scalp electrode (FSE) (top) and between Doppler and FSE (bottom). Static positions on the left graphs and active positions on the right graphs. The average of the absolute values of each difference per participant (represented by a datapoint) was considered. FHR, fetal heart rate.
