
FIGURE 2.
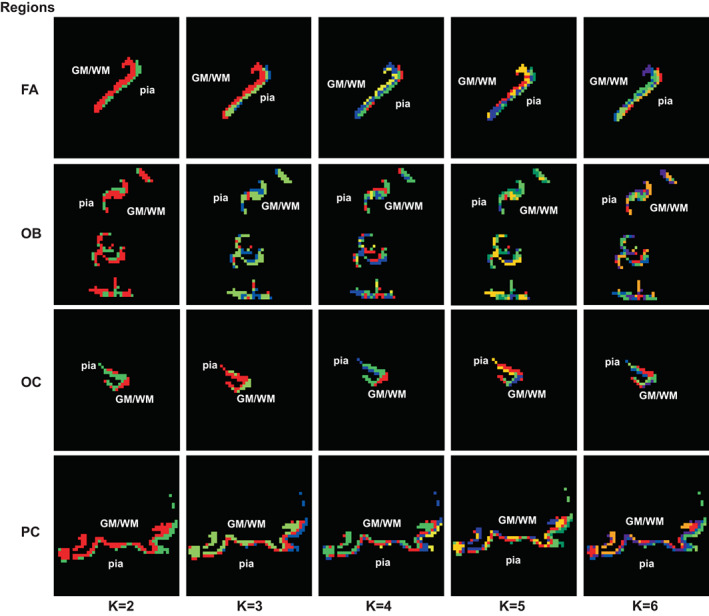
Clustering results of some axial sections of a subject. The results of a section of regions FA, OB, OC, and PC are presented, from top to bottom. The results when the number of clusters is 2–6 are shown from left to right. Different colours represent different categories obtained by clustering. It can be seen that the clustering results have the effect of stratification