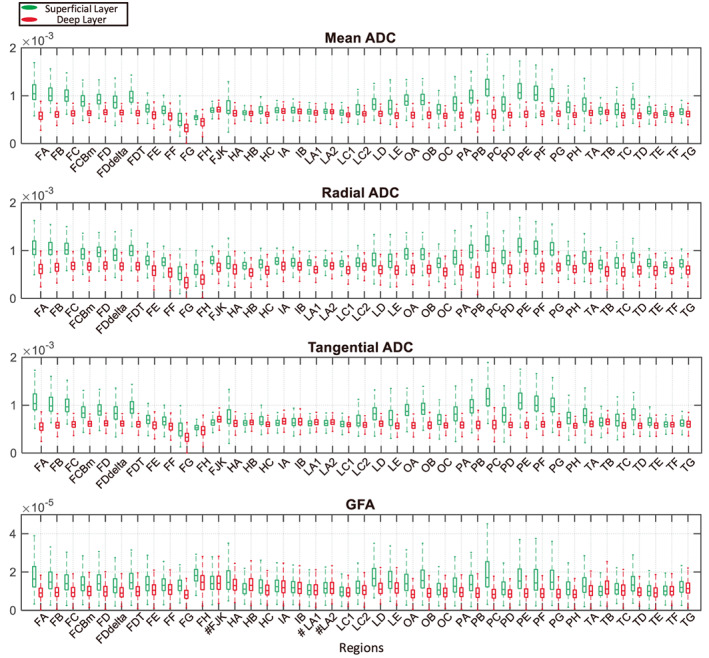
FIGURE 6.

Analysis of the clustering results. Boxplots of the distribution of the voxel's parameters for all subjects are shown. From top to bottom, they correspond to parameters mean ADC, radial ADC, tangential ADC and GFA, respectively. The x‐coordinate represents the region name. Green represents the superficial layer, and red corresponds to the deep layer. On the whole, the superficial value is larger than the deep value for these four parameters. To analyze the differences between the voxel's parameters of two layers, the one‐sample Kolmogorov–Smirnov test was first used to determine whether the data came from a normal distribution. Then, the Welch's t‐test was used for samples from normal distributions to analyze the differences between the two layers. Otherwise, the Wilcoxon rank sum test was used. Additionally, the significance is labeled before each region name on the x‐coordinate. No label indicates p < .001; # indicates no significant difference between the two layers' parameters (three cases for the GFA).
