
FIGURE 8.
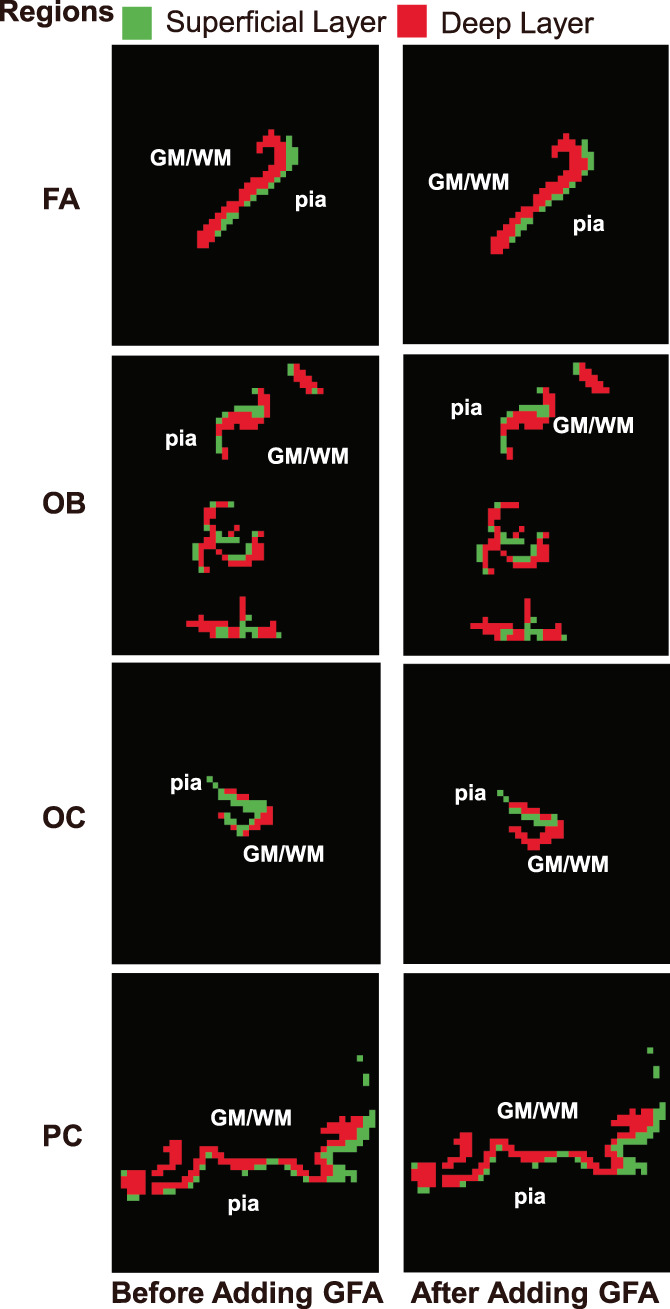
Reclustering results of a subject before and after adding the generalized fractional anisotropy feature for some axial section when the number of clusters is 2. From top to bottom, the results correspond to regions FA, OB, OC, and PC. Green represents the superficial layer, while red corresponds to the deep layer